30
/it/
AIzaSyAYiBZKx7MnpbEhh9jyipgxe19OcubqV5w
April 1, 2024
35884
High income
HIC
false
2
1
Labor force with secondary education (% of total)
2015,2014,2013,2012,2011,2010,2002,2001,2000,1999,1998
Download
Biblioteca di statistiche globali →High income →

Labor force with secondary education (% of total)

Queste statistiche in altri paesi:

AlbaniaAlgeriaAntigua and BarbudaArgentinaArmeniaArubaAustraliaAustriaAzerbaijanBahamas, TheBahrainBarbadosBelarusBelgiumBelizeBermudaBoliviaBosnia and HerzegovinaBotswanaBrazilBritish Virgin IslandsBulgariaCambodiaCanadaCayman IslandsCentral Europe and the BalticsChadChileColombiaCosta RicaCroatiaCubaCyprusCzech RepublicDenmarkDominicaDominican RepublicEarly-demographic dividendEcuadorEgypt, Arab Rep.El SalvadorEstoniaEthiopiaEuro areaEurope & Central AsiaEurope & Central Asia (excluding high income)Europe & Central Asia (IDA & IBRD countries)European UnionFinlandFranceFrench PolynesiaGeorgiaGermanyGhanaGreeceGuatemalaGuyanaHigh incomeHondurasHong Kong SAR, ChinaHungaryIcelandIndiaIndonesiaIran, Islamic Rep.IrelandIsraelItalyJapanJordanKazakhstanKorea, Rep.KosovoKuwaitKyrgyz RepublicLatin America & Caribbean Latin America & Caribbean (excluding high income)Latin America & the Caribbean (IDA & IBRD countries)LatviaLebanonLithuaniaLuxembourgMacao SAR, ChinaMacedonia, FYRMadagascarMalaysiaMaltaMauritiusMexicoMoldovaMongoliaMontenegroMoroccoNamibiaNepalNetherlandsNew CaledoniaNew ZealandNicaraguaNigerNigeriaNorth AmericaNorwayOECD membersOmanPakistanPanamaParaguayPeruPhilippinesPolandPortugalPost-demographic dividendRomaniaRussian FederationRwandaSan MarinoSaudi ArabiaSerbiaSingaporeSlovak RepublicSloveniaSouth AfricaSouth AsiaSouth Asia (IDA & IBRD)SpainSri LankaSt. Kitts and NevisSt. LuciaSt. Vincent and the GrenadinesSwedenSwitzerlandSyrian Arab RepublicTajikistanThailandTimor-LesteTrinidad and TobagoTunisiaTurkeyUgandaUkraineUnited Arab EmiratesUnited KingdomUnited StatesUruguayVenezuela, RBWest Bank and GazaYemen, Rep.

Linea del tempo:

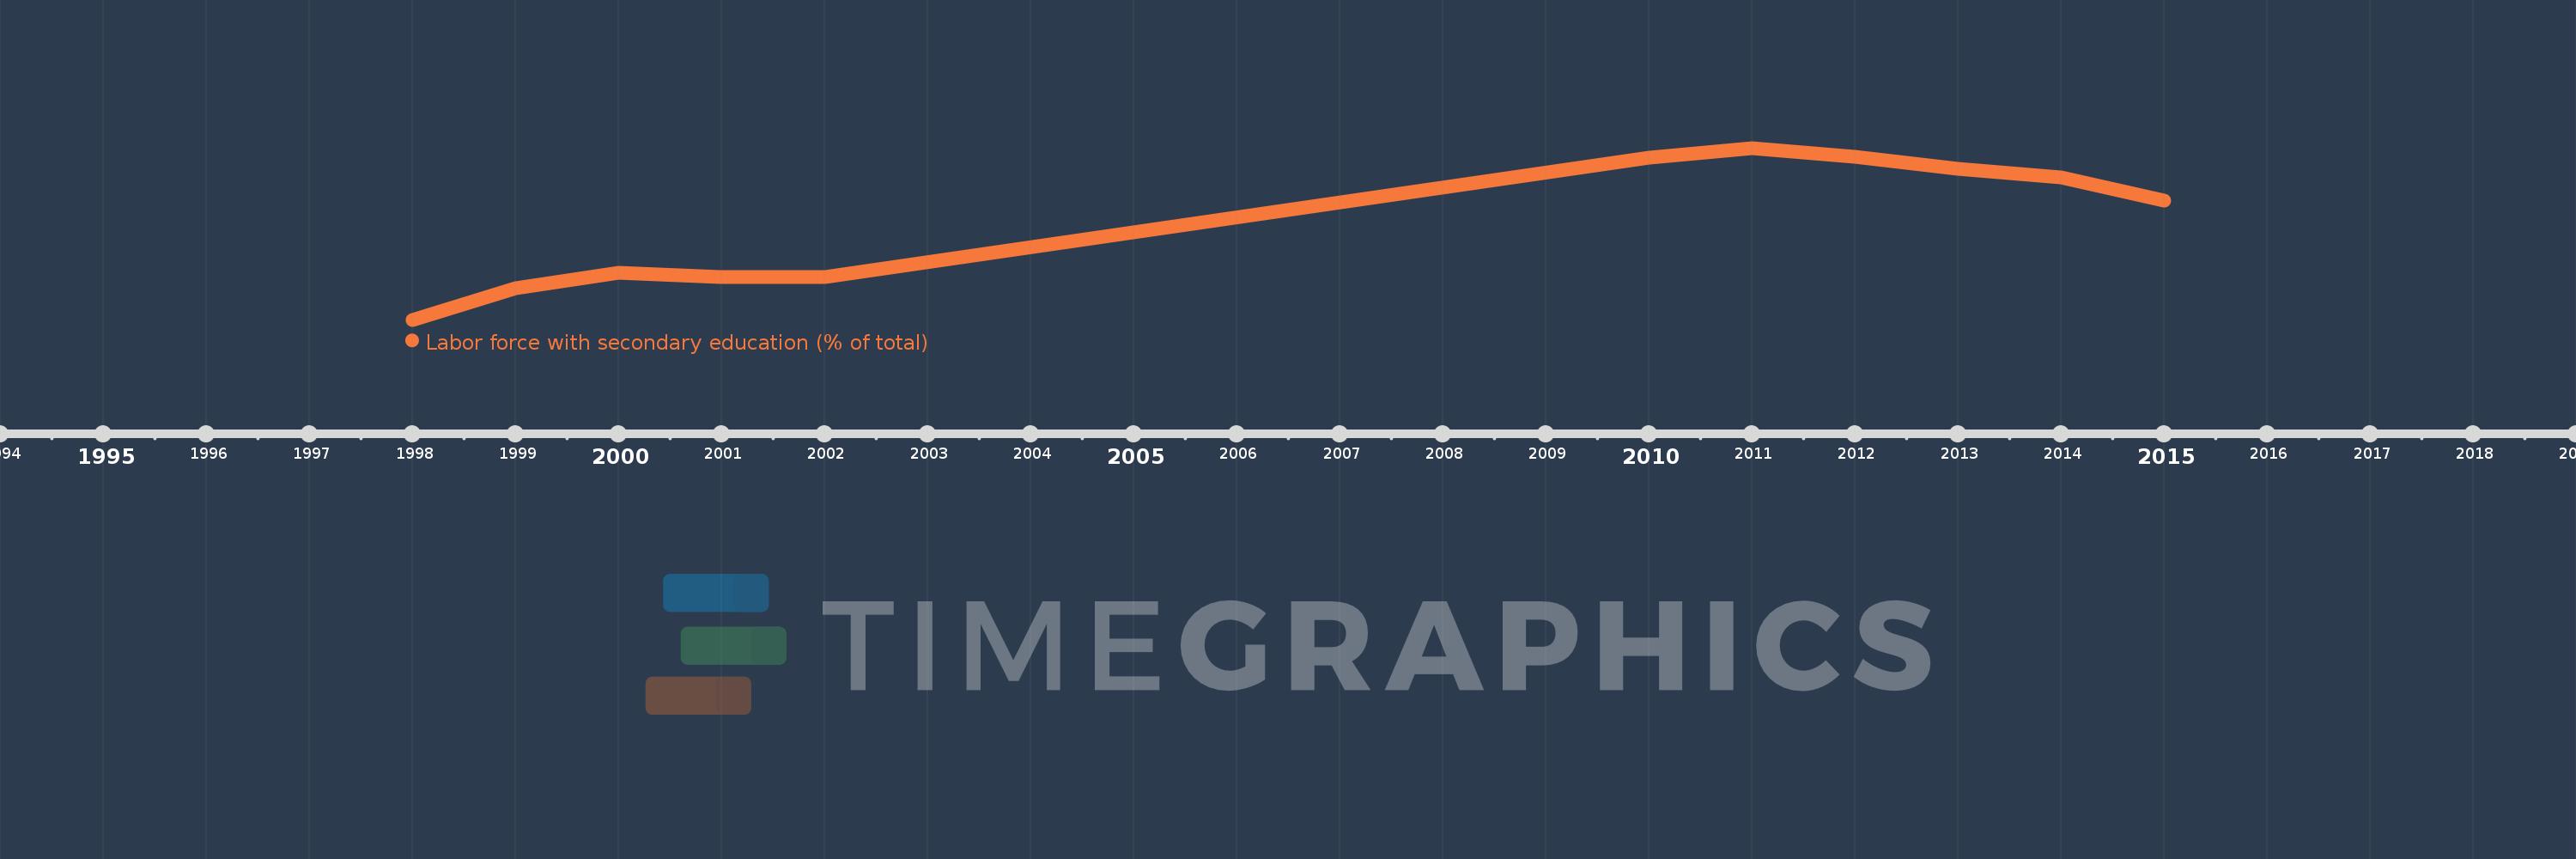
Questa scala temporale mostra un grafico dal 1998 anno al 2015 anno. High income. I dati fino ad 1997 anno non disponibili. Il numero di osservazioni attuali secondo i date: 11.

La fonte (nome):

Indicatori dello sviluppo mondiale

La fonte (organizzazione):

International Labour Organization, Key Indicators of the Labour Market database.

Categorie:

Education, Social Protection & Labor

sono stati aggiornati

23 apr 2017 anni

Indicatori delle variazioni dei valori per anni

In media:
50.319
Minima:
46.87
1 gen 1998 anni
Massimo:
52.949
1 gen 2011 anni
Alla data di osservazione
Valore
Variazione assoluta
La variazione rispetto al valore precedente
1 gen 1998 anni
46.87
+46.87
0.0%
1 gen 1999 anni
47.988
+1.118
2.39%
1 gen 2000 anni
48.522
+0.534
1.11%
1 gen 2001 anni
48.392
-0.13
-0.27%
1 gen 2002 anni
48.373
-0.02
-0.04%
1 gen 2010 anni
52.597
+4.225
8.73%
1 gen 2011 anni
52.949
+0.351
0.67%
1 gen 2012 anni
52.626
-0.323
-0.61%
1 gen 2013 anni
52.2
-0.425
-0.81%
1 gen 2014 anni
51.904
-0.297
-0.57%
1 gen 2015 anni
51.091
-0.813
-1.57%

Classificazione dei paesi secondo i statistiche attuali per anni