29
/it/
it
AIzaSyAYiBZKx7MnpbEhh9jyipgxe19OcubqV5w
April 1, 2024
237315
Serbia
SRB
true
2
1
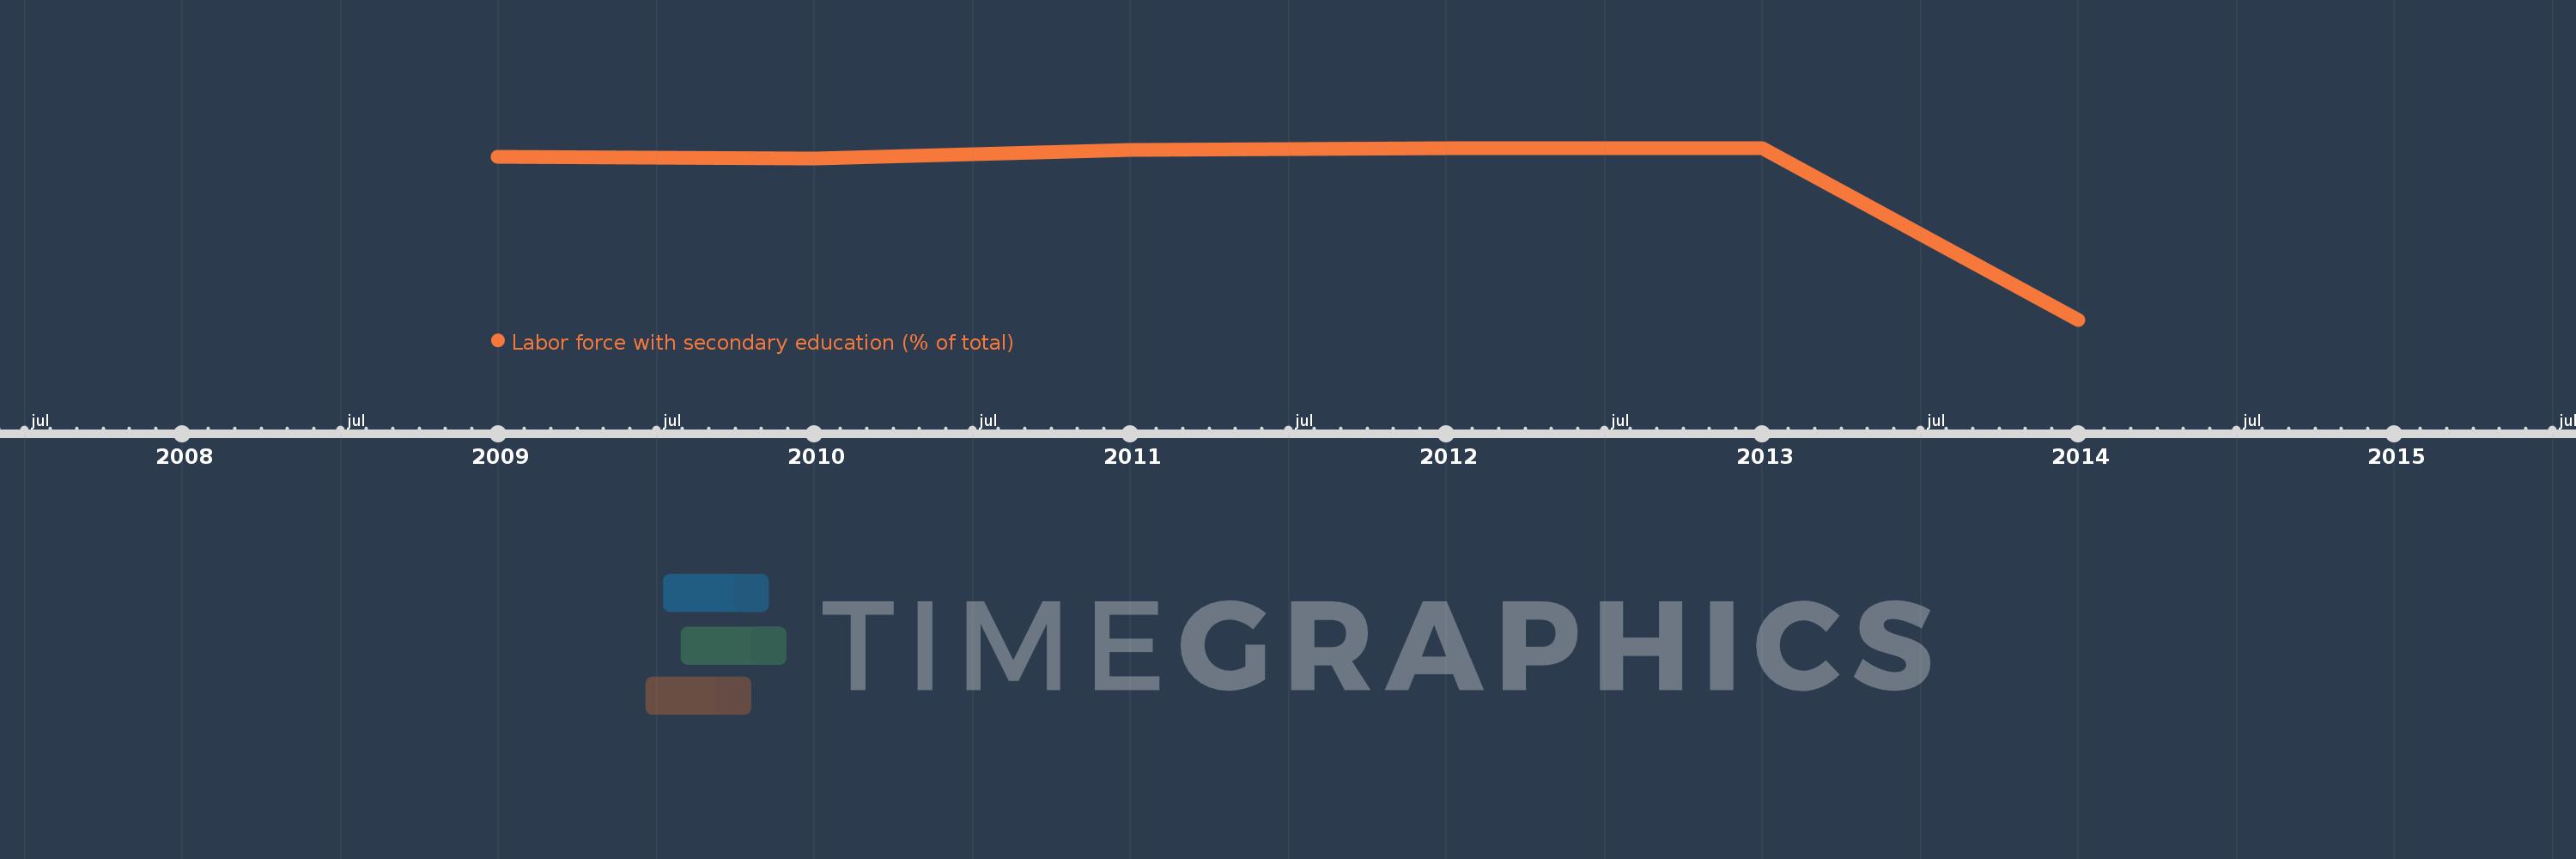
Labor force with secondary education (% of total)
2014,2013,2012,2011,2010,2009
Queste statistiche in altri paesi:
Linea del tempo:
Questa scala temporale mostra un grafico dal 2009 anno al 2014 anno. Serbia. I dati fino ad 2008 anno non disponibili. Il numero di osservazioni attuali secondo i date: 6.
La fonte (nome):
Indicatori dello sviluppo mondiale
La fonte (organizzazione):
International Labour Organization, Key Indicators of the Labour Market database.
Categorie:
Education, Social Protection & Labor
sono stati aggiornati
23 apr 2017 anni
Indicatori delle variazioni dei valori per anni
Minima:
34.1
1 gen 2014 anni
Massimo:
59.2
1 gen 2012 anni
Alla data di osservazione
Valore
Variazione assoluta
La variazione rispetto al valore precedente
1 gen 2009 anni
57.9
+57.9
0.0%
1 gen 2010 anni
57.6
-0.3
-0.52%
1 gen 2011 anni
58.9
+1.3
2.26%
1 gen 2012 anni
59.2
+0.3
0.51%
1 gen 2013 anni
59.1
-0.1
-0.17%
1 gen 2014 anni
34.1
-25.0
-42.3%
Classificazione dei paesi secondo i statistiche attuali per anni


Commenti: