29
/
en
AIzaSyAYiBZKx7MnpbEhh9jyipgxe19OcubqV5w
April 1, 2024
31465
Europe & Central Asia (excluding high income)
ECA
false
2
1
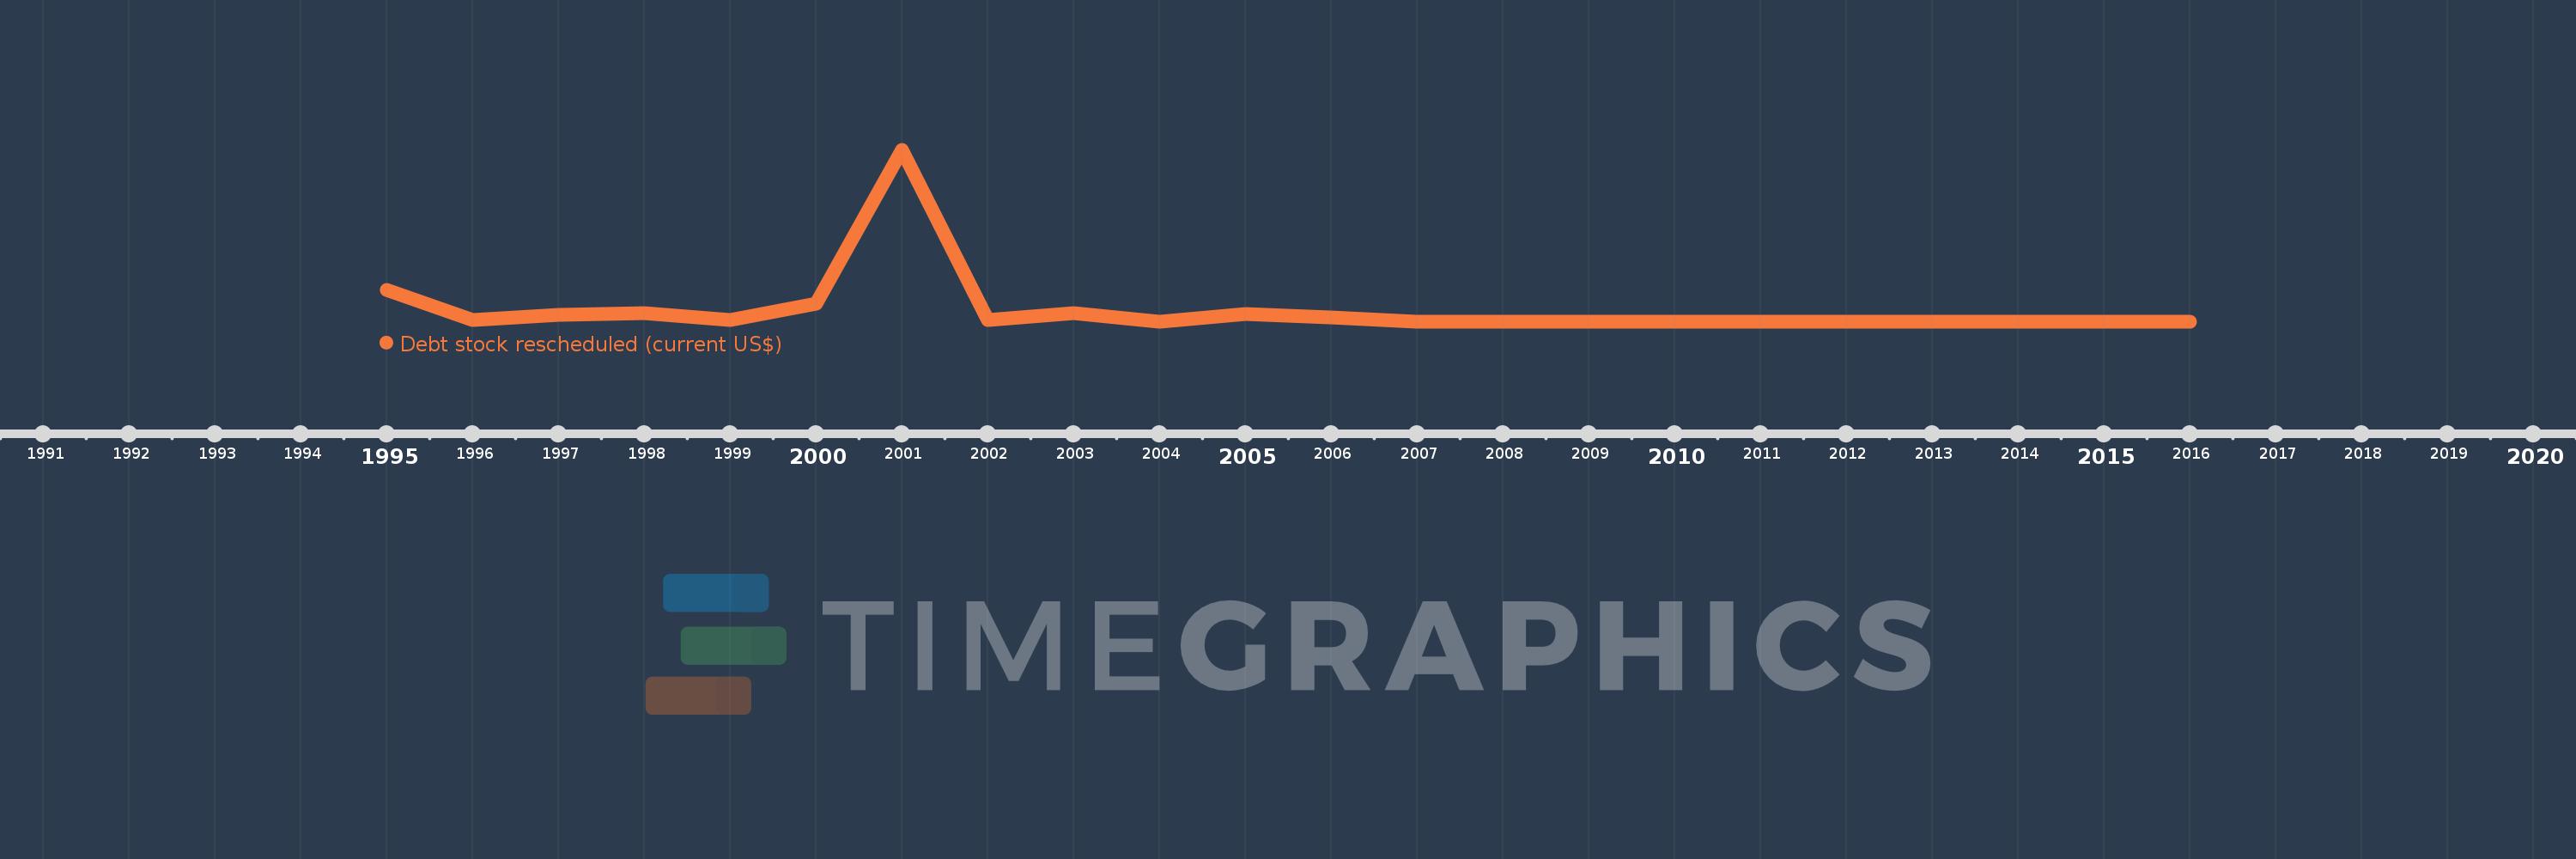
Debt stock rescheduled (current US$)
2016,2015,2014,2013,2012,2011,2010,2009,2008,2007,2006,2005,2004,2003,2002,2001,2000,1999,1998,1997,1996,1995
This statistics in other country:
Timeline:
This timeline shows a graph from 1995 to 2016 of Europe & Central Asia (excluding high income). No data until 1994. Number of actual observations by date: 22.
Source name:
World Development Indicators
Source organization:
World Bank, International Debt Statistics.
Categories, topics:
External Debt
Last updated:
apr 23, 2017
Indicators value changes by year
Maximum:
19.307 bln
jan 1, 2001
At the date of observation
Value
Absolute change
Change from previous value
jan 1, 1995
3.621 bln
+3.621 bln
0.0%
jan 1, 1996
225.0 mln
-3.396 bln
-93.79%
jan 1, 1997
760.047 mln
+535.047 mln
237.8%
jan 1, 1998
953.437 mln
+193.39 mln
25.44%
jan 1, 1999
223.898 mln
-729.539 mln
-76.52%
jan 1, 2000
2.08 bln
+1.856 bln
829.02%
jan 1, 2001
19.307 bln
+17.227 bln
828.19%
jan 1, 2002
265.976 mln
-19.041 bln
-98.62%
jan 1, 2003
978.467 mln
+712.491 mln
267.88%
jan 1, 2004
3.988 mln
-974.479 mln
-99.59%
jan 1, 2005
937.283 mln
+933.295 mln
23.4K%
jan 1, 2006
486.756 mln
-450.527 mln
-48.07%
jan 1, 2007
8.951 mln
-477.805 mln
-98.16%
jan 1, 2008
0.0
-8.951 mln
-100.0%
jan 1, 2009
16.155 mln
+16.155 mln
%
jan 1, 2010
0.0
-16.155 mln
-100.0%
jan 1, 2014
18.379 mln
+18.379 mln
%
jan 1, 2015
0.0
-18.379 mln
-100.0%
Ranking of countries by current statistics by years


Comments: