29
/
en
AIzaSyAYiBZKx7MnpbEhh9jyipgxe19OcubqV5w
April 1, 2024
222007
Peru
PER
true
2
1
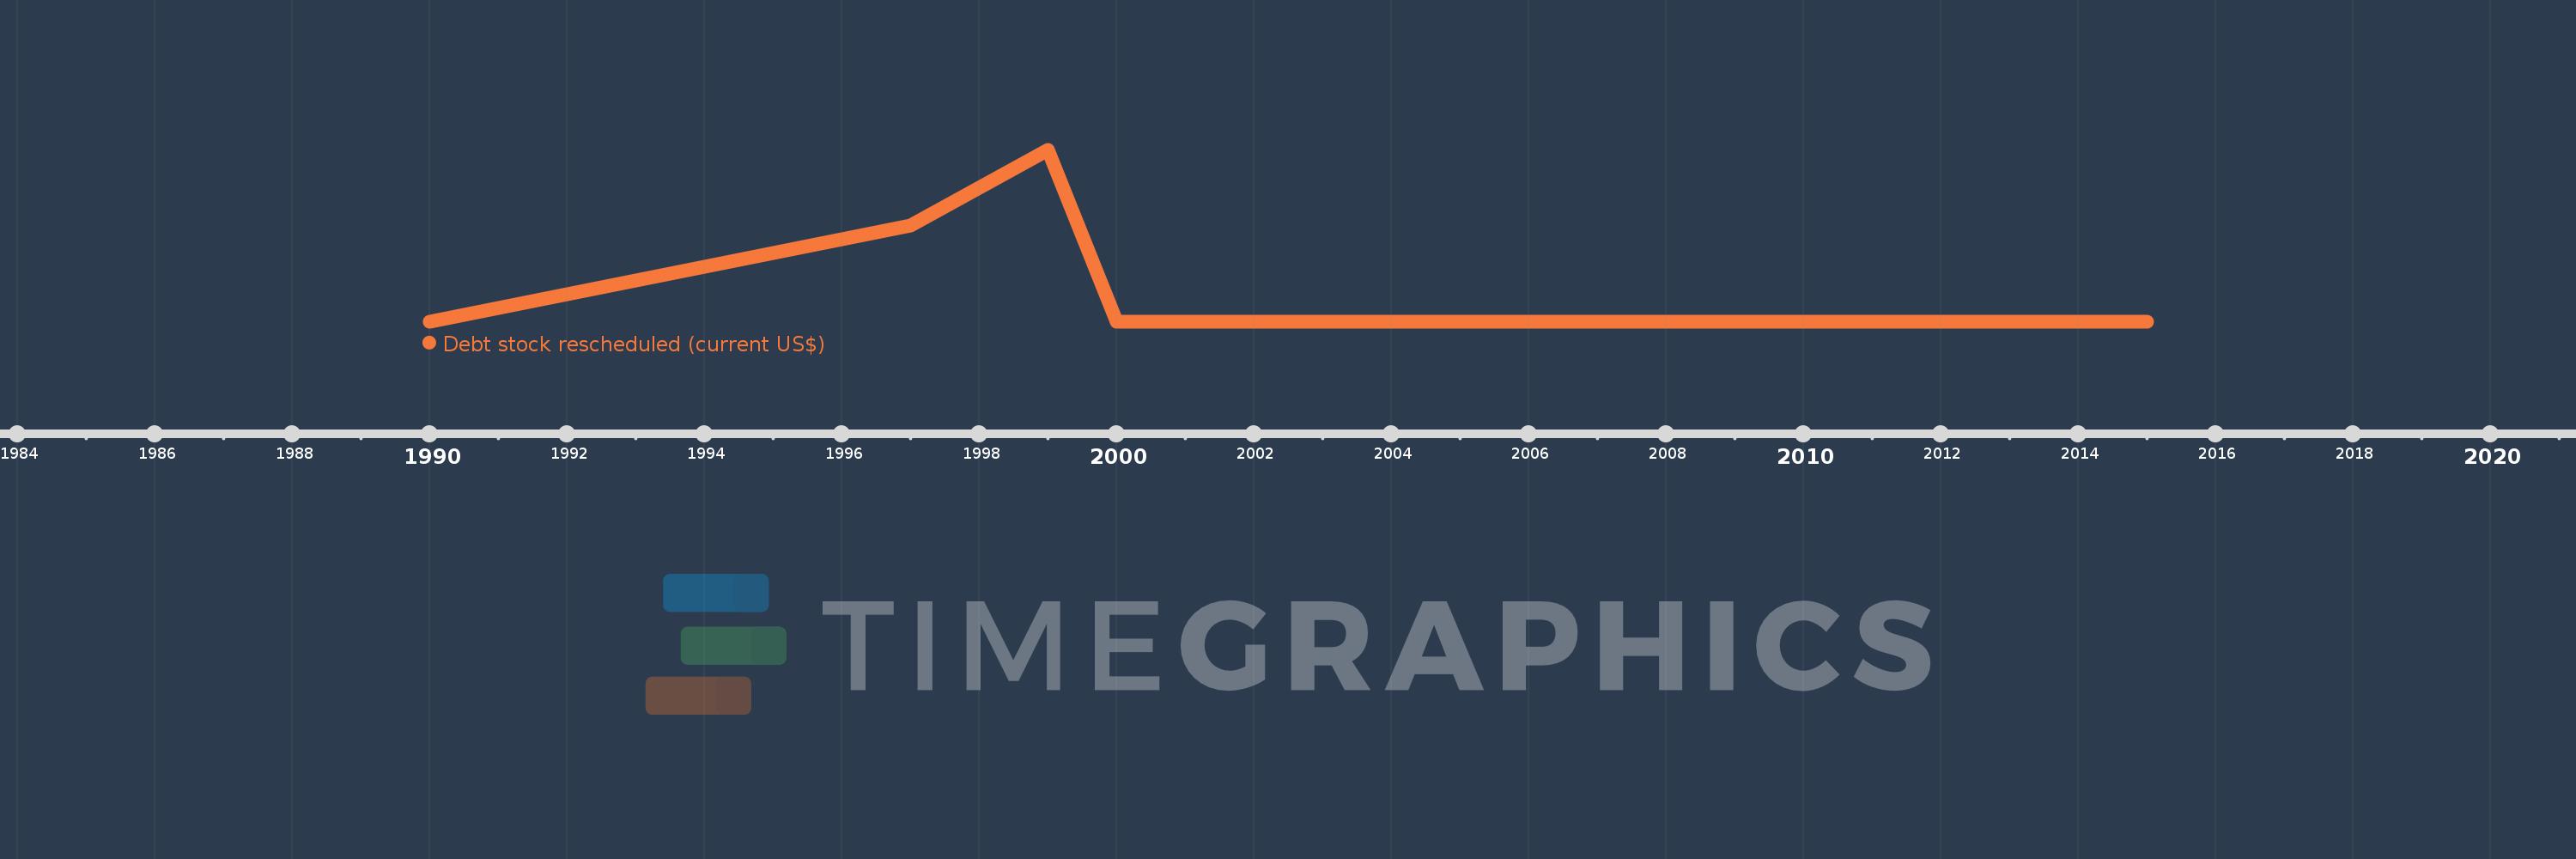
Debt stock rescheduled (current US$)
2015,2006,2000,1999,1997,1990
This statistics in other country:
Timeline:
This timeline shows a graph from 1990 to 2015 of Peru. No data until 1989. Number of actual observations by date: 6.
Source name:
World Development Indicators
Source organization:
World Bank, International Debt Statistics.
Categories, topics:
External Debt
Last updated:
apr 23, 2017
Indicators value changes by year
Maximum:
4.415 bln
jan 1, 1999
At the date of observation
Value
Absolute change
Change from previous value
jan 1, 1990
1.911 mln
+1.911 mln
0.0%
jan 1, 1997
2.489 bln
+2.487 bln
130.12K%
jan 1, 1999
4.415 bln
+1.926 bln
77.4%
jan 1, 2000
5.817 mln
-4.409 bln
-99.87%
jan 1, 2006
0.0
-5.817 mln
-100.0%
Ranking of countries by current statistics by years


Comments: