29
/
en
AIzaSyAYiBZKx7MnpbEhh9jyipgxe19OcubqV5w
April 1, 2024
48878
Middle East & North Africa (excluding high income)
MNA
false
2
1
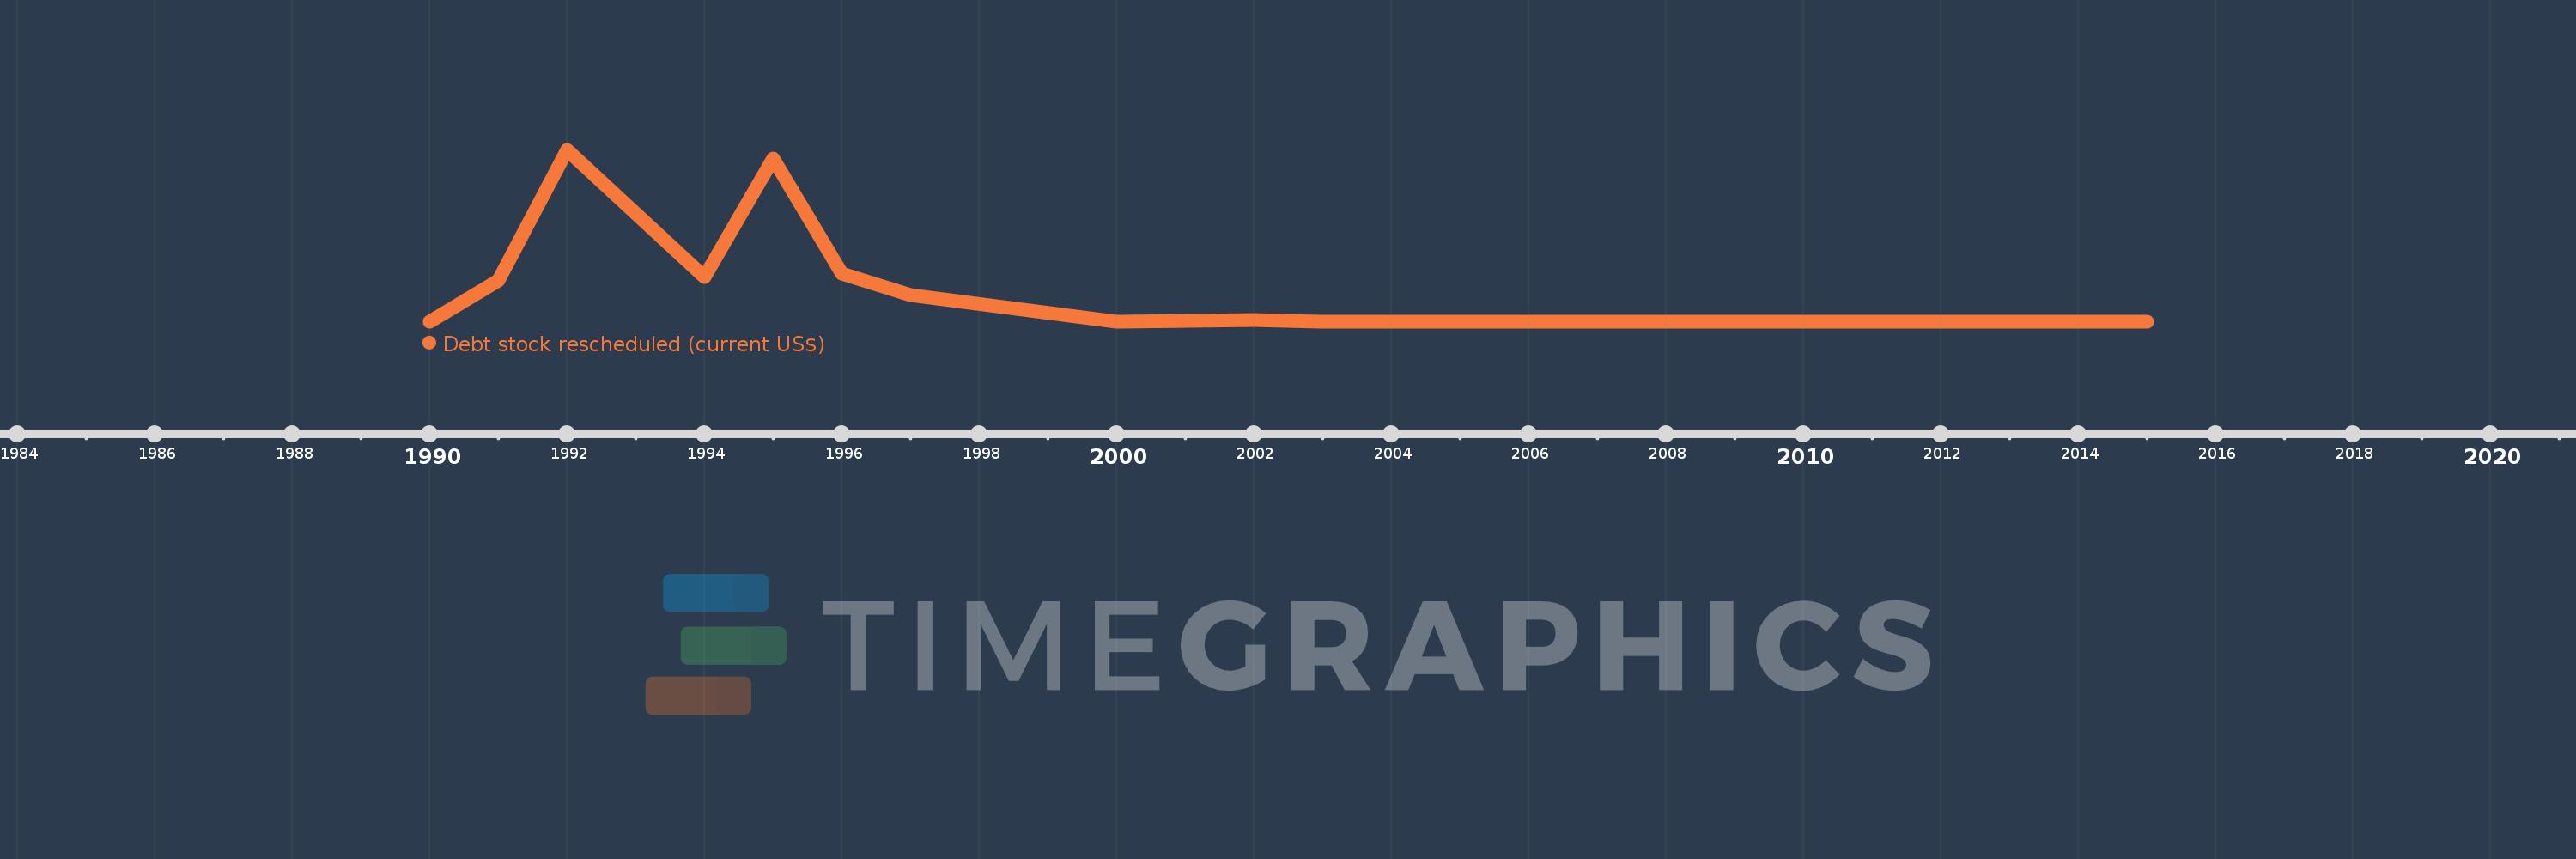
Debt stock rescheduled (current US$)
2015,2011,2008,2005,2004,2003,2002,2000,1997,1996,1995,1994,1992,1991,1990
This statistics in other country:
Timeline:
This timeline shows a graph from 1990 to 2015 of Middle East & North Africa (excluding high income). No data until 1989. Number of actual observations by date: 15.
Source name:
World Development Indicators
Source organization:
World Bank, International Debt Statistics.
Categories, topics:
External Debt
Last updated:
apr 23, 2017
Indicators value changes by year
Maximum:
11.355 bln
jan 1, 1992
At the date of observation
Value
Absolute change
Change from previous value
jan 1, 1990
19.206 mln
+19.206 mln
0.0%
jan 1, 1991
2.732 bln
+2.713 bln
14.13K%
jan 1, 1992
11.355 bln
+8.623 bln
315.63%
jan 1, 1994
2.978 bln
-8.377 bln
-73.77%
jan 1, 1995
10.785 bln
+7.807 bln
262.1%
jan 1, 1996
3.178 bln
-7.607 bln
-70.53%
jan 1, 1997
1.805 bln
-1.373 bln
-43.2%
jan 1, 2000
0.0
-1.805 bln
-100.0%
jan 1, 2002
142.438 mln
+142.438 mln
%
jan 1, 2003
0.0
-142.438 mln
-100.0%
jan 1, 2005
16.45 mln
+16.45 mln
%
jan 1, 2008
0.0
-16.45 mln
-100.0%
jan 1, 2011
1.757 mln
+1.757 mln
%
jan 1, 2015
0.0
-1.757 mln
-100.0%
Ranking of countries by current statistics by years


Comments: