29
/
en
AIzaSyAYiBZKx7MnpbEhh9jyipgxe19OcubqV5w
April 1, 2024
284589
Yemen, Rep.
YEM
true
2
1
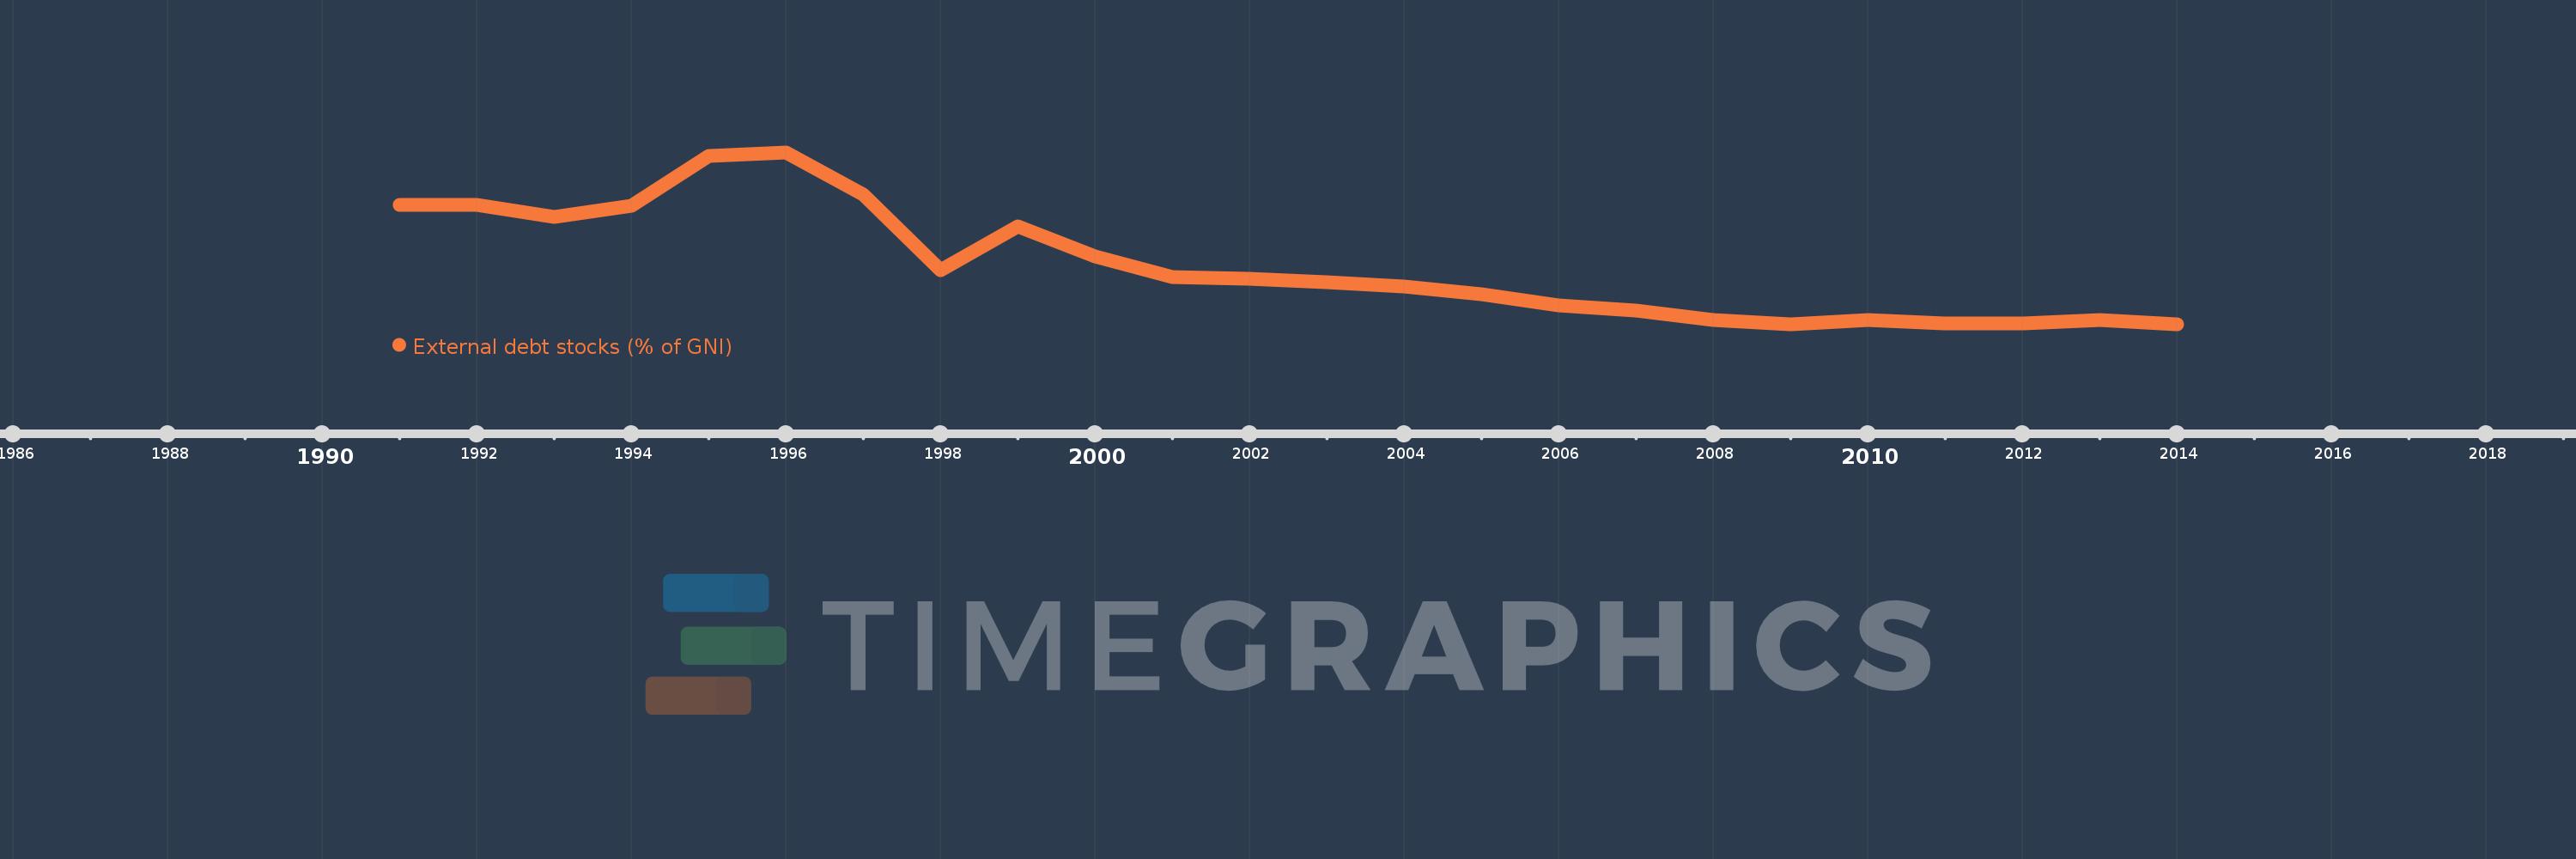
External debt stocks (% of GNI)
2014,2013,2012,2011,2010,2009,2008,2007,2006,2005,2004,2003,2002,2001,2000,1999,1998,1997,1996,1995,1994,1993,1992,1991
This statistics in other country:
Timeline:
This timeline shows a graph from 1991 to 2014 of Yemen, Rep.. No data until 1990. Number of actual observations by date: 24.
Source name:
World Development Indicators
Source organization:
World Bank, International Debt Statistics.
Categories, topics:
Economy & Growth, External Debt
Last updated:
apr 23, 2017
Indicators value changes by year
Minimum:
21.786
jan 1, 2009
Maximum:
153.443
jan 1, 1996
At the date of observation
Value
Absolute change
Change from previous value
jan 1, 1991
113.235
+113.235
0.0%
jan 1, 1992
112.925
-0.309
-0.27%
jan 1, 1993
104.112
-8.814
-7.8%
jan 1, 1994
112.86
+8.748
8.4%
jan 1, 1995
150.519
+37.659
33.37%
jan 1, 1996
153.443
+2.924
1.94%
jan 1, 1997
121.255
-32.188
-20.98%
jan 1, 1998
62.92
-58.334
-48.11%
jan 1, 1999
96.828
+33.907
53.89%
jan 1, 2000
73.895
-22.933
-23.68%
jan 1, 2001
58.136
-15.759
-21.33%
jan 1, 2002
56.615
-1.521
-2.62%
jan 1, 2003
53.909
-2.706
-4.78%
jan 1, 2004
50.977
-2.932
-5.44%
jan 1, 2005
44.732
-6.245
-12.25%
jan 1, 2006
36.181
-8.551
-19.12%
jan 1, 2007
32.017
-4.165
-11.51%
jan 1, 2008
25.272
-6.745
-21.07%
jan 1, 2009
21.786
-3.486
-13.79%
jan 1, 2010
24.835
+3.049
13.99%
jan 1, 2011
22.24
-2.595
-10.45%
jan 1, 2012
22.246
+0.006
0.03%
jan 1, 2013
24.982
+2.736
12.3%
jan 1, 2014
21.801
-3.181
-12.73%
Ranking of countries by current statistics by years


Comments: