29
/
en
AIzaSyAYiBZKx7MnpbEhh9jyipgxe19OcubqV5w
April 1, 2024
80474
Belarus
BLR
true
2
1
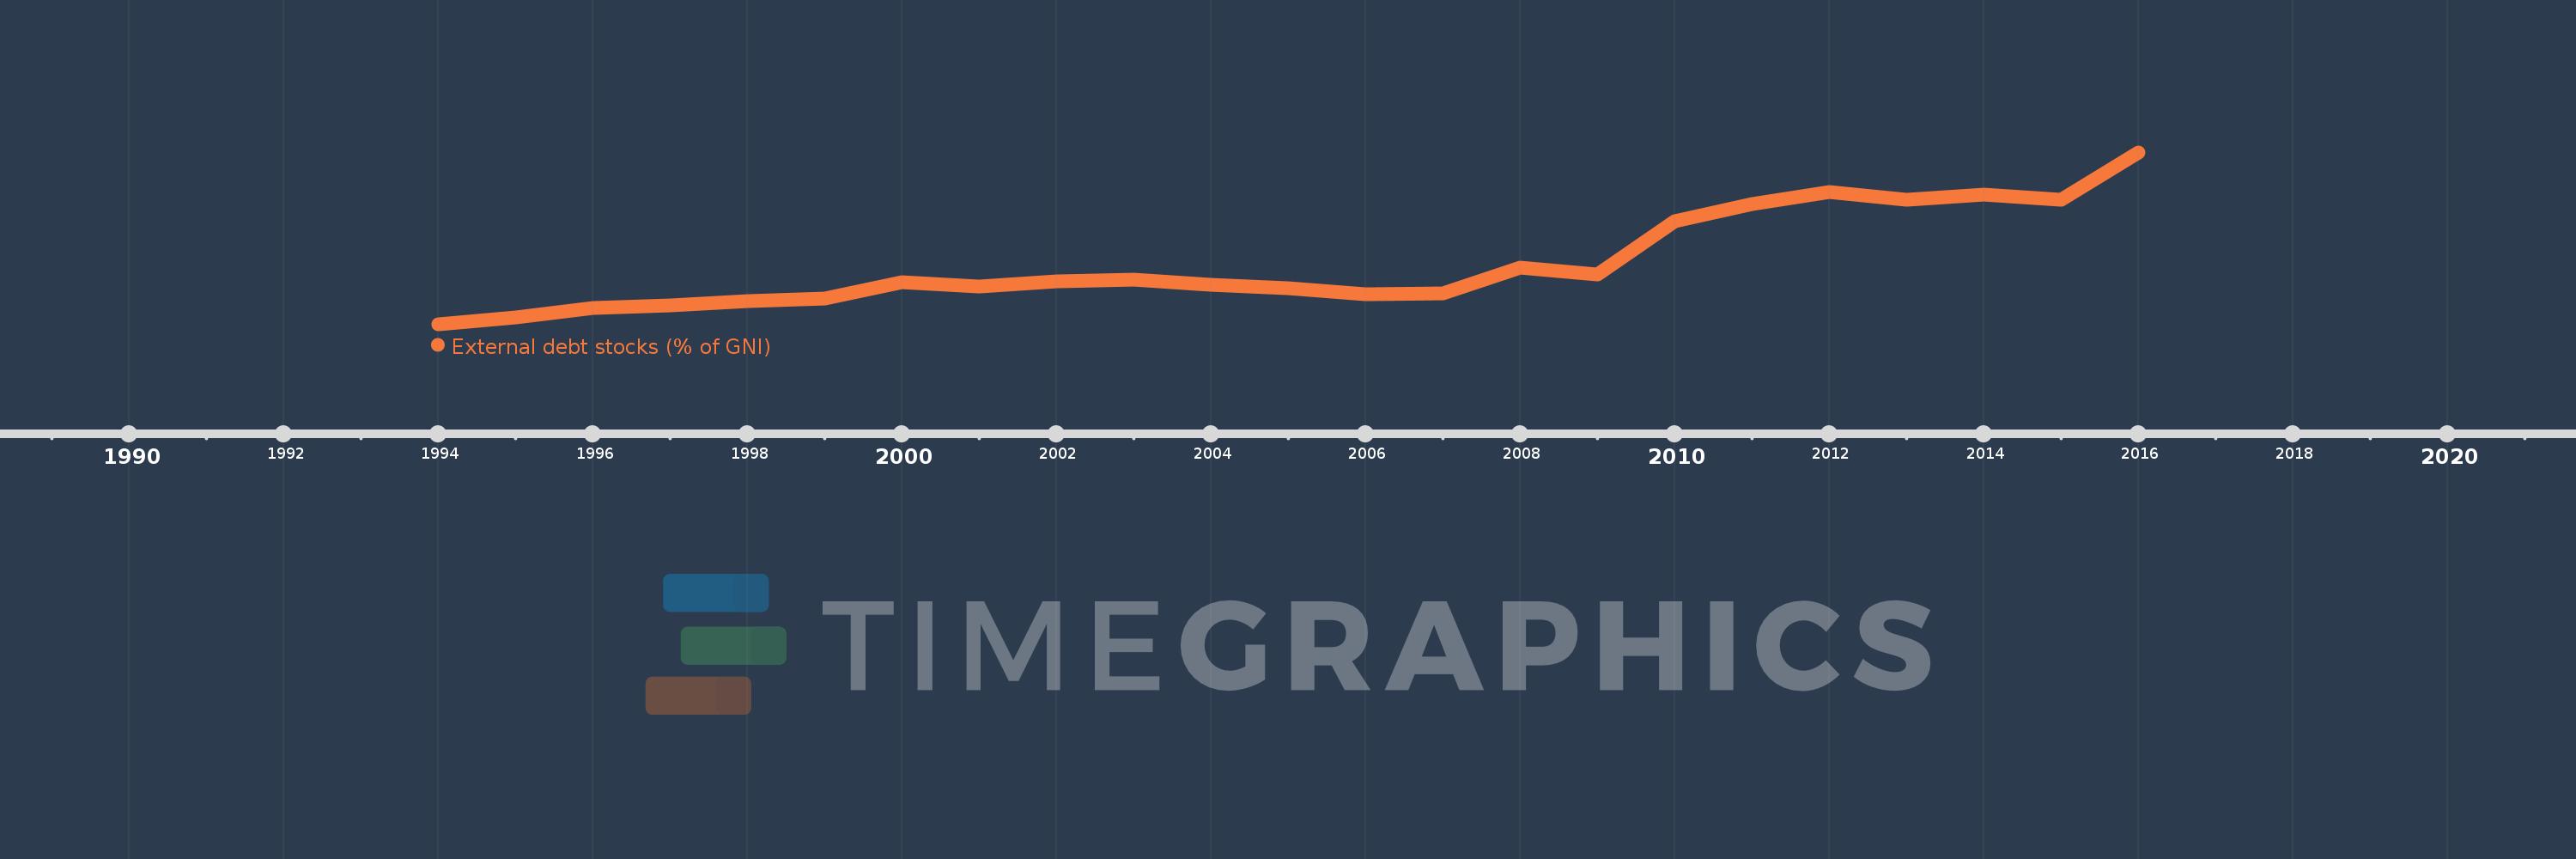
External debt stocks (% of GNI)
2016,2015,2014,2013,2012,2011,2010,2009,2008,2007,2006,2005,2004,2003,2002,2001,2000,1999,1998,1997,1996,1995,1994
This statistics in other country:
Timeline:
This timeline shows a graph from 1994 to 2016 of Belarus. No data until 1993. Number of actual observations by date: 23.
Source name:
World Development Indicators
Source organization:
World Bank, International Debt Statistics.
Categories, topics:
Economy & Growth, External Debt
Last updated:
apr 23, 2017
Indicators value changes by year
Maximum:
72.736
jan 1, 2016
At the date of observation
Value
Absolute change
Change from previous value
jan 1, 1994
5.945
+5.945
0.0%
jan 1, 1995
8.697
+2.752
46.3%
jan 1, 1996
12.166
+3.469
39.89%
jan 1, 1997
13.302
+1.136
9.34%
jan 1, 1998
14.827
+1.525
11.46%
jan 1, 1999
15.774
+0.947
6.38%
jan 1, 2000
22.347
+6.573
41.67%
jan 1, 2001
20.647
-1.7
-7.61%
jan 1, 2002
22.746
+2.099
10.17%
jan 1, 2003
23.335
+0.588
2.59%
jan 1, 2004
21.173
-2.161
-9.26%
jan 1, 2005
19.862
-1.311
-6.19%
jan 1, 2006
17.512
-2.35
-11.83%
jan 1, 2007
17.809
+0.297
1.69%
jan 1, 2008
27.92
+10.111
56.77%
jan 1, 2009
25.27
-2.65
-9.49%
jan 1, 2010
45.906
+20.637
81.67%
jan 1, 2011
52.558
+6.652
14.49%
jan 1, 2012
57.462
+4.904
9.33%
jan 1, 2013
54.318
-3.144
-5.47%
jan 1, 2014
56.176
+1.858
3.42%
jan 1, 2015
54.264
-1.912
-3.4%
jan 1, 2016
72.736
+18.473
34.04%
Ranking of countries by current statistics by years


Comments: