29
/
en
AIzaSyAYiBZKx7MnpbEhh9jyipgxe19OcubqV5w
April 1, 2024
64648
Albania
ALB
true
2
1
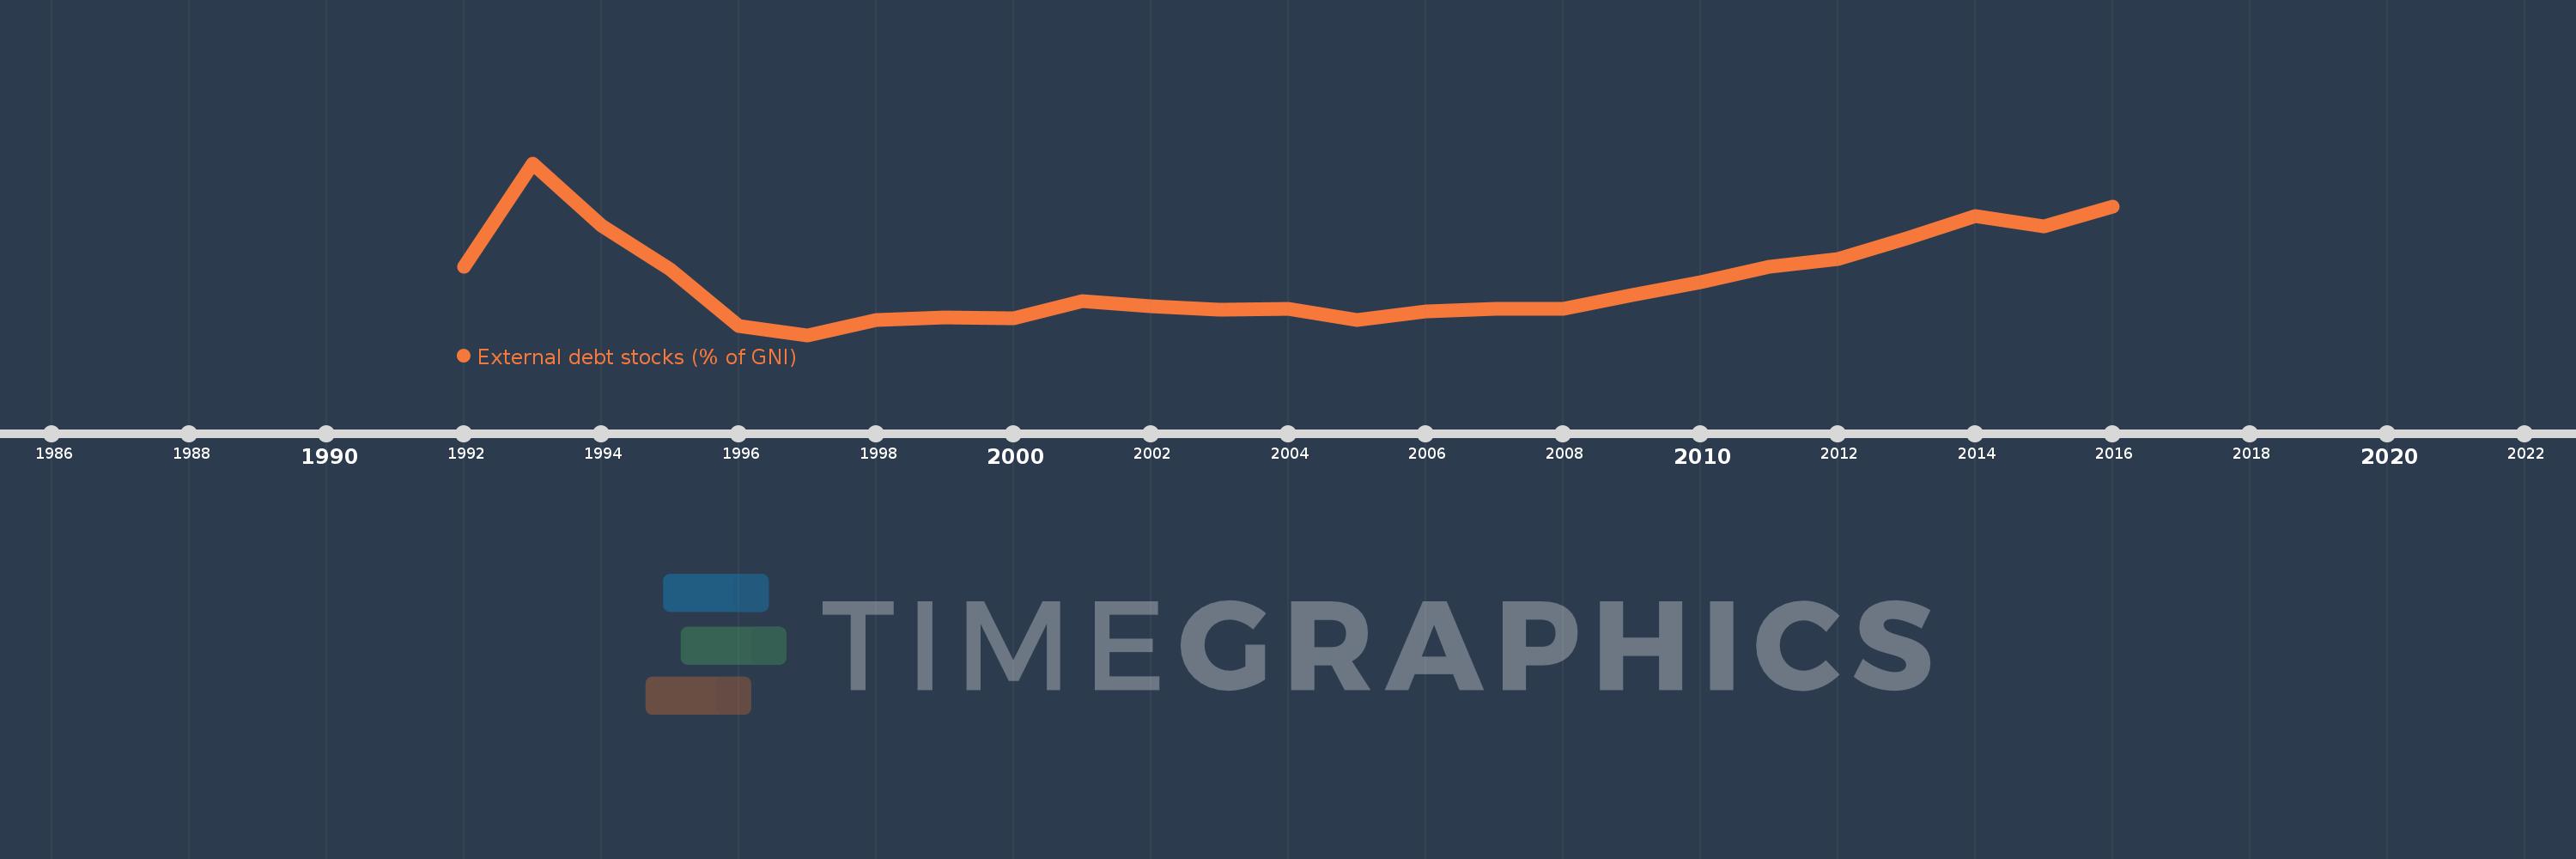
External debt stocks (% of GNI)
2016,2015,2014,2013,2012,2011,2010,2009,2008,2007,2006,2005,2004,2003,2002,2001,2000,1999,1998,1997,1996,1995,1994,1993,1992
This statistics in other country:
Timeline:
This timeline shows a graph from 1992 to 2016 of Albania. No data until 1991. Number of actual observations by date: 25.
Source name:
World Development Indicators
Source organization:
World Bank, International Debt Statistics.
Categories, topics:
Economy & Growth, External Debt
Last updated:
apr 23, 2017
Indicators value changes by year
Minimum:
14.531
jan 1, 1997
Maximum:
92.942
jan 1, 1993
At the date of observation
Value
Absolute change
Change from previous value
jan 1, 1992
45.772
+45.772
0.0%
jan 1, 1993
92.942
+47.17
103.05%
jan 1, 1994
64.637
-28.304
-30.45%
jan 1, 1995
44.363
-20.275
-31.37%
jan 1, 1996
18.592
-25.771
-58.09%
jan 1, 1997
14.531
-4.061
-21.84%
jan 1, 1998
21.434
+6.903
47.51%
jan 1, 1999
22.4
+0.967
4.51%
jan 1, 2000
22.148
-0.252
-1.13%
jan 1, 2001
30.02
+7.871
35.54%
jan 1, 2002
27.58
-2.44
-8.13%
jan 1, 2003
26.003
-1.577
-5.72%
jan 1, 2004
26.307
+0.305
1.17%
jan 1, 2005
21.483
-4.825
-18.34%
jan 1, 2006
25.283
+3.801
17.69%
jan 1, 2007
26.68
+1.397
5.52%
jan 1, 2008
26.389
-0.291
-1.09%
jan 1, 2009
32.769
+6.38
24.18%
jan 1, 2010
38.741
+5.972
18.23%
jan 1, 2011
45.53
+6.789
17.52%
jan 1, 2012
49.12
+3.589
7.88%
jan 1, 2013
58.556
+9.436
19.21%
jan 1, 2014
68.746
+10.19
17.4%
jan 1, 2015
64.018
-4.728
-6.88%
jan 1, 2016
73.242
+9.224
14.41%
Ranking of countries by current statistics by years


Comments: