29
/
en
AIzaSyAYiBZKx7MnpbEhh9jyipgxe19OcubqV5w
April 1, 2024
283674
West Bank and Gaza
PSE
true
2
1
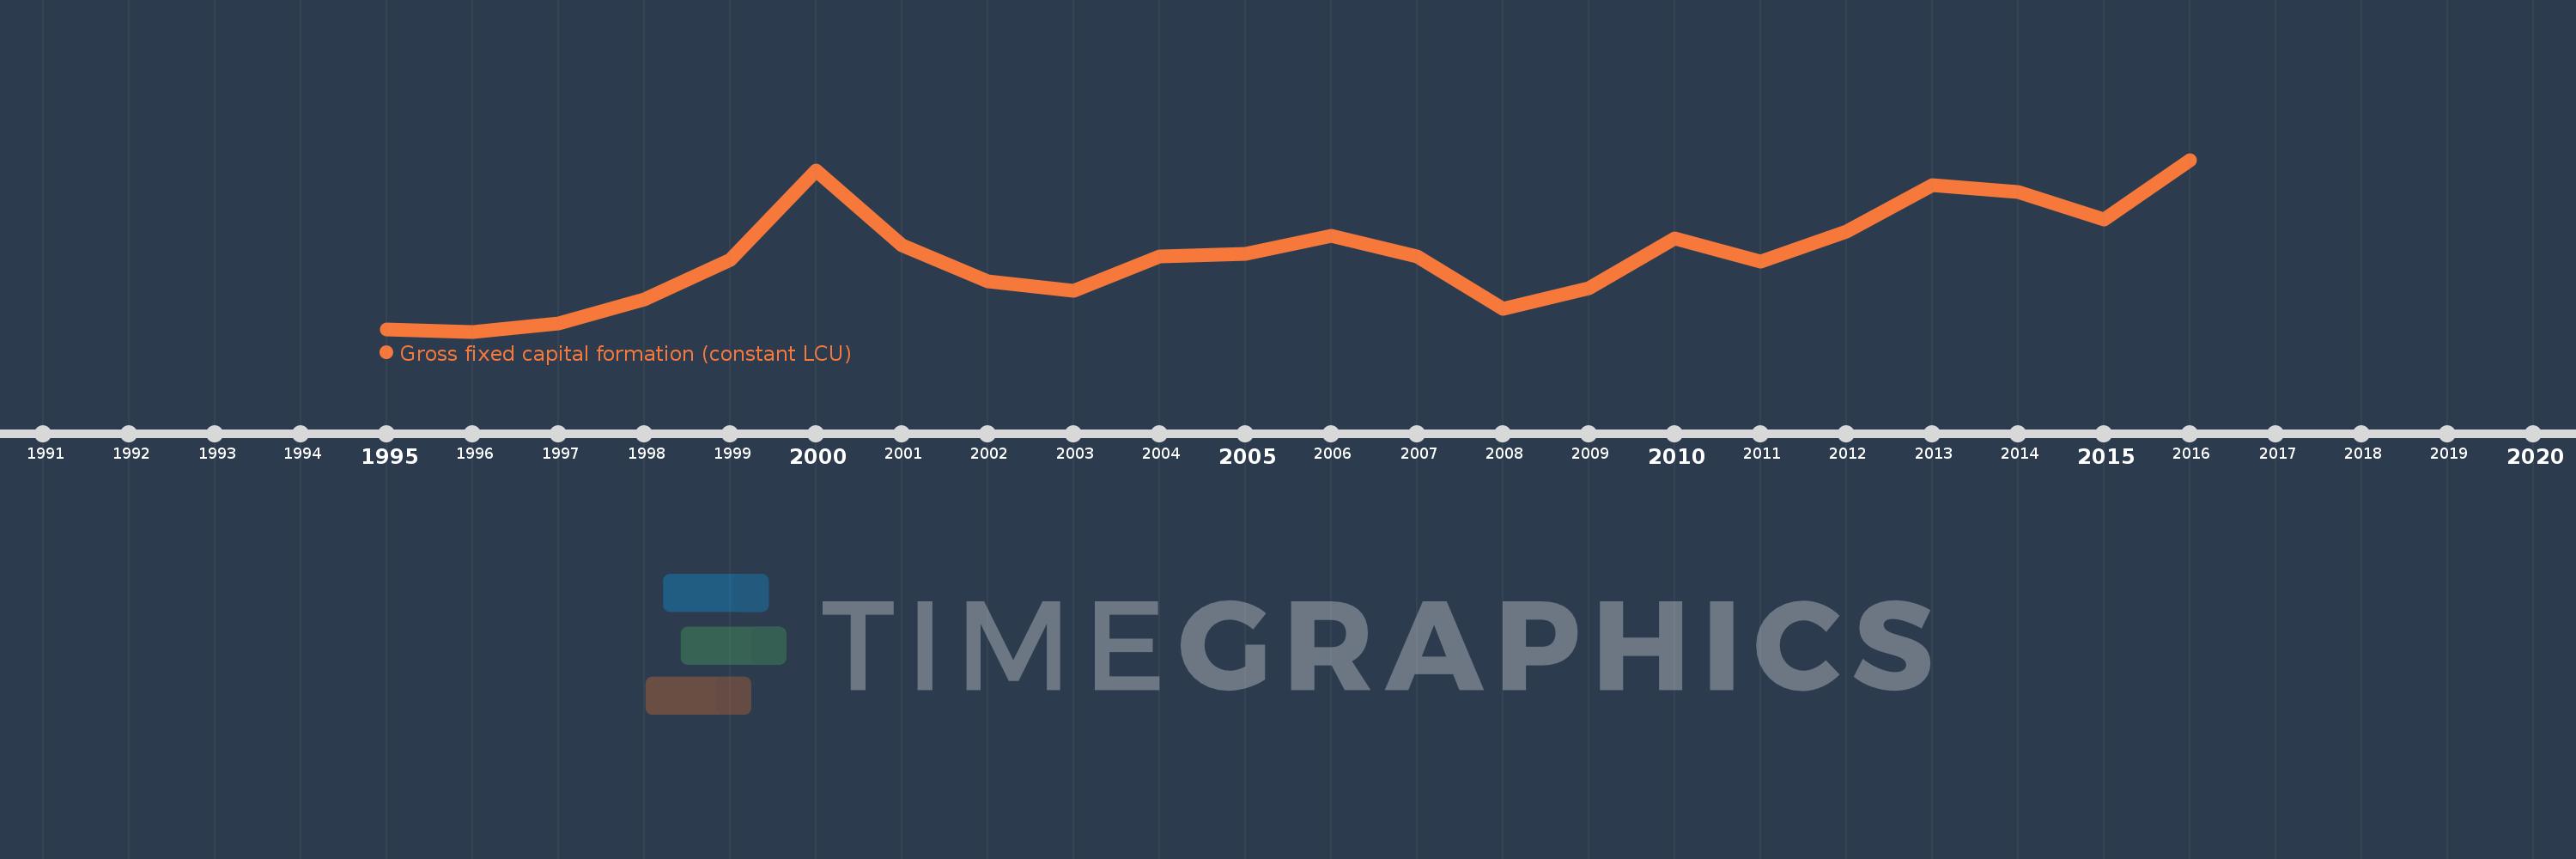
Gross fixed capital formation (constant LCU)
2016,2015,2014,2013,2012,2011,2010,2009,2008,2007,2006,2005,2004,2003,2002,2001,2000,1999,1998,1997,1996,1995
This statistics in other country:
AlbaniaAlgeriaAngolaAntigua and BarbudaArgentinaArmeniaAustraliaAustriaAzerbaijanBahamas, TheBahrainBangladeshBarbadosBelarusBelgiumBelizeBeninBhutanBoliviaBosnia and HerzegovinaBotswanaBrazilBrunei DarussalamBulgariaBurkina FasoBurundiCabo VerdeCambodiaCameroonCanadaChadChileChinaColombiaComorosCongo, Dem. Rep.Congo, Rep.Costa RicaCote d'IvoireCroatiaCubaCyprusCzech RepublicDenmarkDjiboutiDominican RepublicEcuadorEgypt, Arab Rep.El SalvadorEquatorial GuineaEritreaEstoniaEthiopiaFinlandFranceGabonGambia, TheGeorgiaGermanyGhanaGreeceGuatemalaGuineaGuinea-BissauHaitiHondurasHong Kong SAR, ChinaHungaryIcelandIndiaIndonesiaIran, Islamic Rep.IrelandIsraelItalyJamaicaJapanJordanKazakhstanKenyaKorea, Rep.KosovoKyrgyz RepublicLao PDRLatviaLebanonLiberiaLithuaniaLuxembourgMacao SAR, ChinaMacedonia, FYRMadagascarMalawiMalaysiaMaliMaltaMauritaniaMauritiusMexicoMoldovaMongoliaMontenegroMoroccoMozambiqueNamibiaNepalNetherlandsNew ZealandNicaraguaNigerNigeriaNorwayOmanPakistanPanamaPapua New GuineaParaguayPeruPhilippinesPolandPortugalPuerto RicoRomaniaRussian FederationRwandaSaudi ArabiaSenegalSerbiaSeychellesSierra LeoneSingaporeSlovak RepublicSloveniaSomaliaSouth AfricaSouth SudanSpainSri LankaSudanSurinameSwazilandSwedenSwitzerlandSyrian Arab RepublicTajikistanTanzaniaThailandTimor-LesteTogoTrinidad and TobagoTunisiaTurkeyUgandaUkraineUnited Arab EmiratesUnited KingdomUnited StatesUruguayUzbekistanVanuatuVenezuela, RBVietnamWest Bank and GazaZambiaZimbabwe Timeline:
This timeline shows a graph from 1995 to 2016 of West Bank and Gaza. No data until 1994. Number of actual observations by date: 22.
Source name:
World Development Indicators
Source organization:
World Bank national accounts data, and OECD National Accounts data files.
Categories, topics:
Economy & Growth
Last updated:
apr 23, 2017
Indicators value changes by year
Minimum:
2.961 bln
jan 1, 1996
Maximum:
7.441 bln
jan 1, 2016
At the date of observation
Value
Absolute change
Change from previous value
jan 1, 1995
3.013 bln
+3.013 bln
0.0%
jan 1, 1996
2.961 bln
-52.197 mln
-1.73%
jan 1, 1997
3.173 bln
+211.84 mln
7.16%
jan 1, 1998
3.812 bln
+639.024 mln
20.14%
jan 1, 1999
4.836 bln
+1.025 bln
26.89%
jan 1, 2000
7.162 bln
+2.326 bln
48.09%
jan 1, 2001
5.206 bln
-1.956 bln
-27.31%
jan 1, 2002
4.273 bln
-933.313 mln
-17.93%
jan 1, 2003
4.024 bln
-248.704 mln
-5.82%
jan 1, 2004
4.927 bln
+902.453 mln
22.43%
jan 1, 2005
4.982 bln
+55.451 mln
1.13%
jan 1, 2006
5.458 bln
+475.75 mln
9.55%
jan 1, 2007
4.921 bln
-536.51 mln
-9.83%
jan 1, 2008
3.543 bln
-1.378 bln
-28.0%
jan 1, 2009
4.085 bln
+541.924 mln
15.29%
jan 1, 2010
5.383 bln
+1.298 bln
31.77%
jan 1, 2011
4.795 bln
-587.54 mln
-10.92%
jan 1, 2012
5.56 bln
+765.079 mln
15.95%
jan 1, 2013
6.771 bln
+1.21 bln
21.76%
jan 1, 2014
6.595 bln
-175.088 mln
-2.59%
jan 1, 2015
5.874 bln
-721.291 mln
-10.94%
jan 1, 2016
7.441 bln
+1.566 bln
26.66%
Ranking of countries by current statistics by years


Comments: