29
/
en
AIzaSyAYiBZKx7MnpbEhh9jyipgxe19OcubqV5w
April 1, 2024
244632
Somalia
SOM
true
2
1
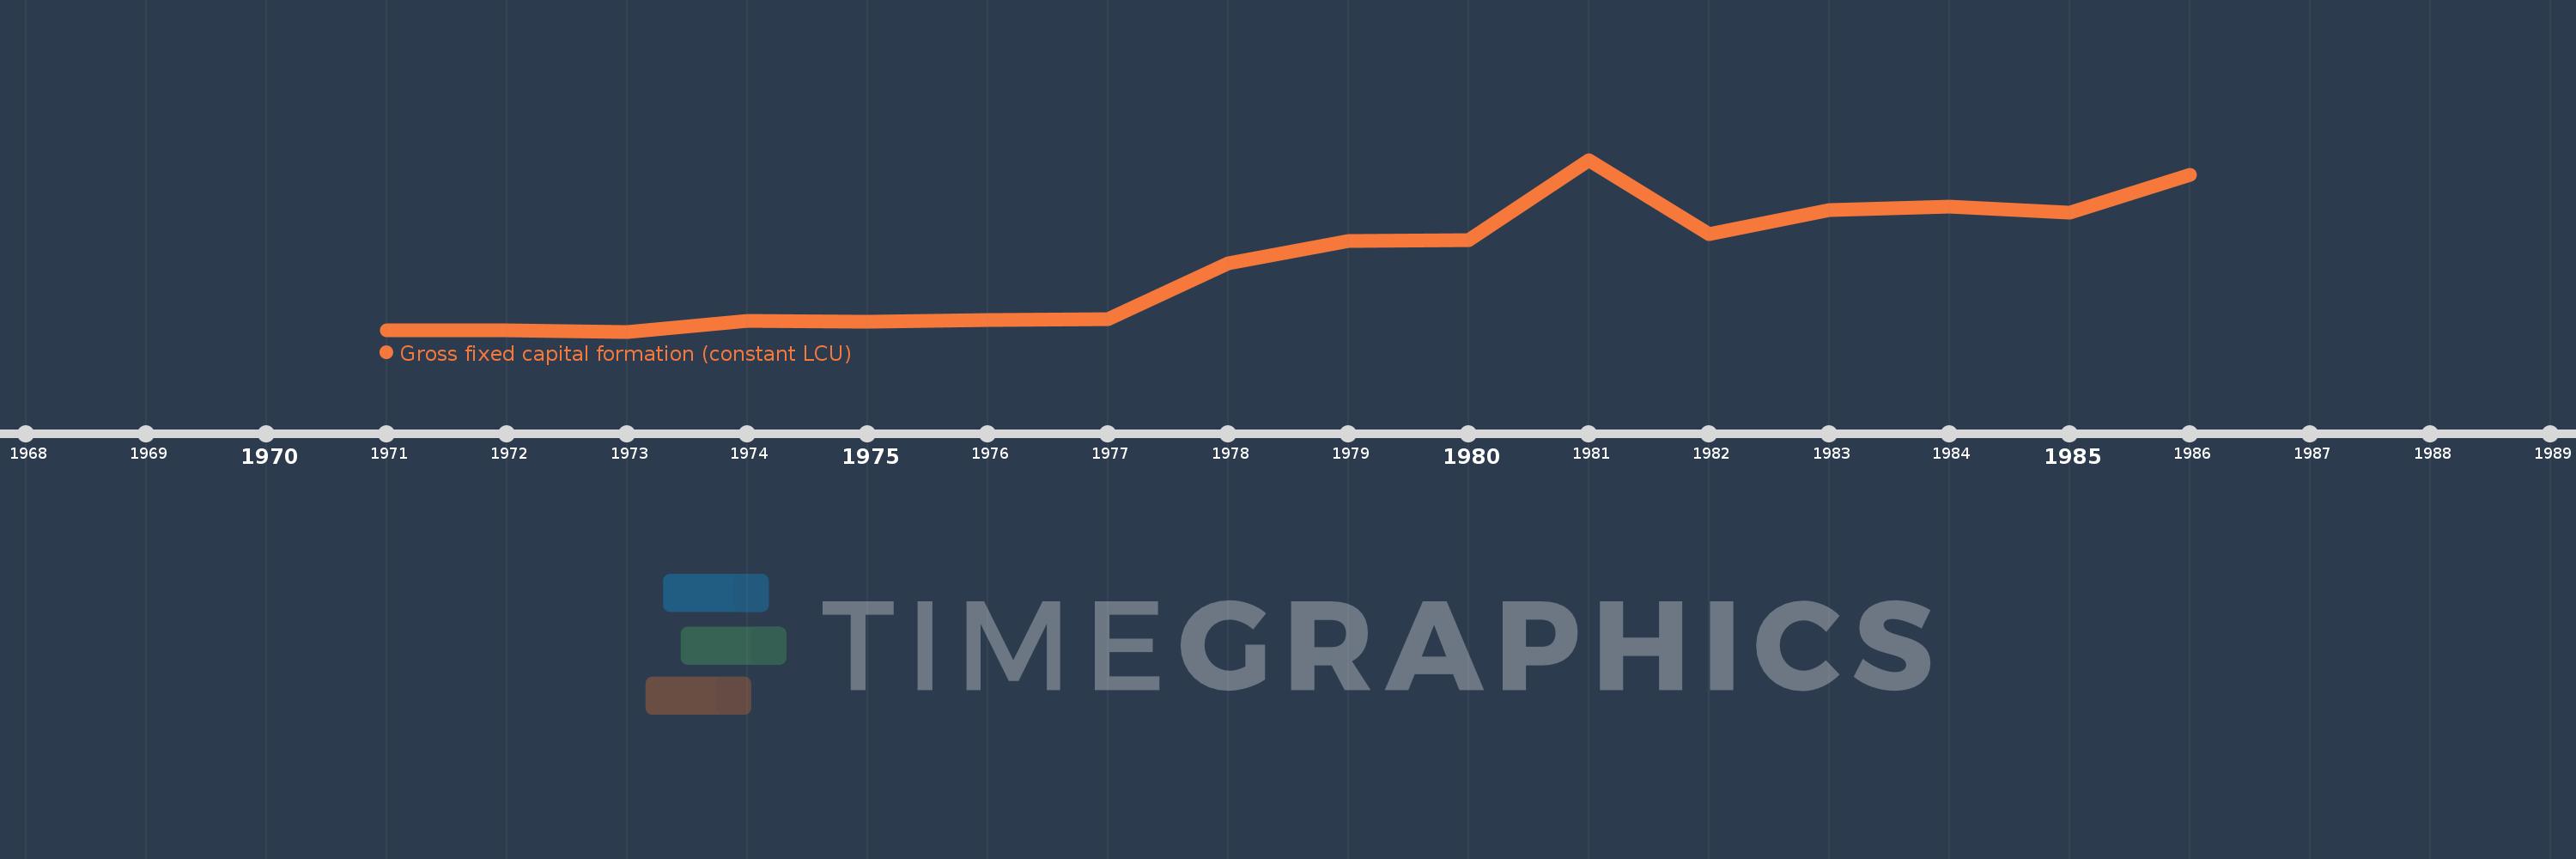
Gross fixed capital formation (constant LCU)
1986,1985,1984,1983,1982,1981,1980,1979,1978,1977,1976,1975,1974,1973,1972,1971
This statistics in other country:
AlbaniaAlgeriaAngolaAntigua and BarbudaArgentinaArmeniaAustraliaAustriaAzerbaijanBahamas, TheBahrainBangladeshBarbadosBelarusBelgiumBelizeBeninBhutanBoliviaBosnia and HerzegovinaBotswanaBrazilBrunei DarussalamBulgariaBurkina FasoBurundiCabo VerdeCambodiaCameroonCanadaChadChileChinaColombiaComorosCongo, Dem. Rep.Congo, Rep.Costa RicaCote d'IvoireCroatiaCubaCyprusCzech RepublicDenmarkDjiboutiDominican RepublicEcuadorEgypt, Arab Rep.El SalvadorEquatorial GuineaEritreaEstoniaEthiopiaFinlandFranceGabonGambia, TheGeorgiaGermanyGhanaGreeceGuatemalaGuineaGuinea-BissauHaitiHondurasHong Kong SAR, ChinaHungaryIcelandIndiaIndonesiaIran, Islamic Rep.IrelandIsraelItalyJamaicaJapanJordanKazakhstanKenyaKorea, Rep.KosovoKyrgyz RepublicLao PDRLatviaLebanonLiberiaLithuaniaLuxembourgMacao SAR, ChinaMacedonia, FYRMadagascarMalawiMalaysiaMaliMaltaMauritaniaMauritiusMexicoMoldovaMongoliaMontenegroMoroccoMozambiqueNamibiaNepalNetherlandsNew ZealandNicaraguaNigerNigeriaNorwayOmanPakistanPanamaPapua New GuineaParaguayPeruPhilippinesPolandPortugalPuerto RicoRomaniaRussian FederationRwandaSaudi ArabiaSenegalSerbiaSeychellesSierra LeoneSingaporeSlovak RepublicSloveniaSomaliaSouth AfricaSouth SudanSpainSri LankaSudanSurinameSwazilandSwedenSwitzerlandSyrian Arab RepublicTajikistanTanzaniaThailandTimor-LesteTogoTrinidad and TobagoTunisiaTurkeyUgandaUkraineUnited Arab EmiratesUnited KingdomUnited StatesUruguayUzbekistanVanuatuVenezuela, RBVietnamWest Bank and GazaZambiaZimbabwe Timeline:
This timeline shows a graph from 1971 to 1986 of Somalia. No data until 1970. Number of actual observations by date: 16.
Source name:
World Development Indicators
Source organization:
World Bank national accounts data, and OECD National Accounts data files.
Categories, topics:
Economy & Growth
Last updated:
apr 23, 2017
Indicators value changes by year
Minimum:
2.687 bln
jan 1, 1973
Maximum:
25.577 bln
jan 1, 1981
At the date of observation
Value
Absolute change
Change from previous value
jan 1, 1971
2.909 bln
+2.909 bln
0.0%
jan 1, 1972
2.909 bln
0.0
0.0%
jan 1, 1973
2.687 bln
-221.5 mln
-7.62%
jan 1, 1974
4.095 bln
+1.407 bln
52.37%
jan 1, 1975
3.987 bln
-107.5 mln
-2.63%
jan 1, 1976
4.22 bln
+232.699 mln
5.84%
jan 1, 1977
4.329 bln
+108.999 mln
2.58%
jan 1, 1978
11.748 bln
+7.419 bln
171.4%
jan 1, 1979
14.706 bln
+2.958 bln
25.18%
jan 1, 1980
14.892 bln
+186.0 mln
1.26%
jan 1, 1981
25.577 bln
+10.685 bln
71.75%
jan 1, 1982
15.684 bln
-9.894 bln
-38.68%
jan 1, 1983
18.884 bln
+3.2 bln
20.4%
jan 1, 1984
19.331 bln
+447.001 mln
2.37%
jan 1, 1985
18.496 bln
-835.201 mln
-4.32%
jan 1, 1986
23.588 bln
+5.092 bln
27.53%
Ranking of countries by current statistics by years


Comments: