29
/
en
AIzaSyAYiBZKx7MnpbEhh9jyipgxe19OcubqV5w
April 1, 2024
160550
Israel
ISR
true
2
1
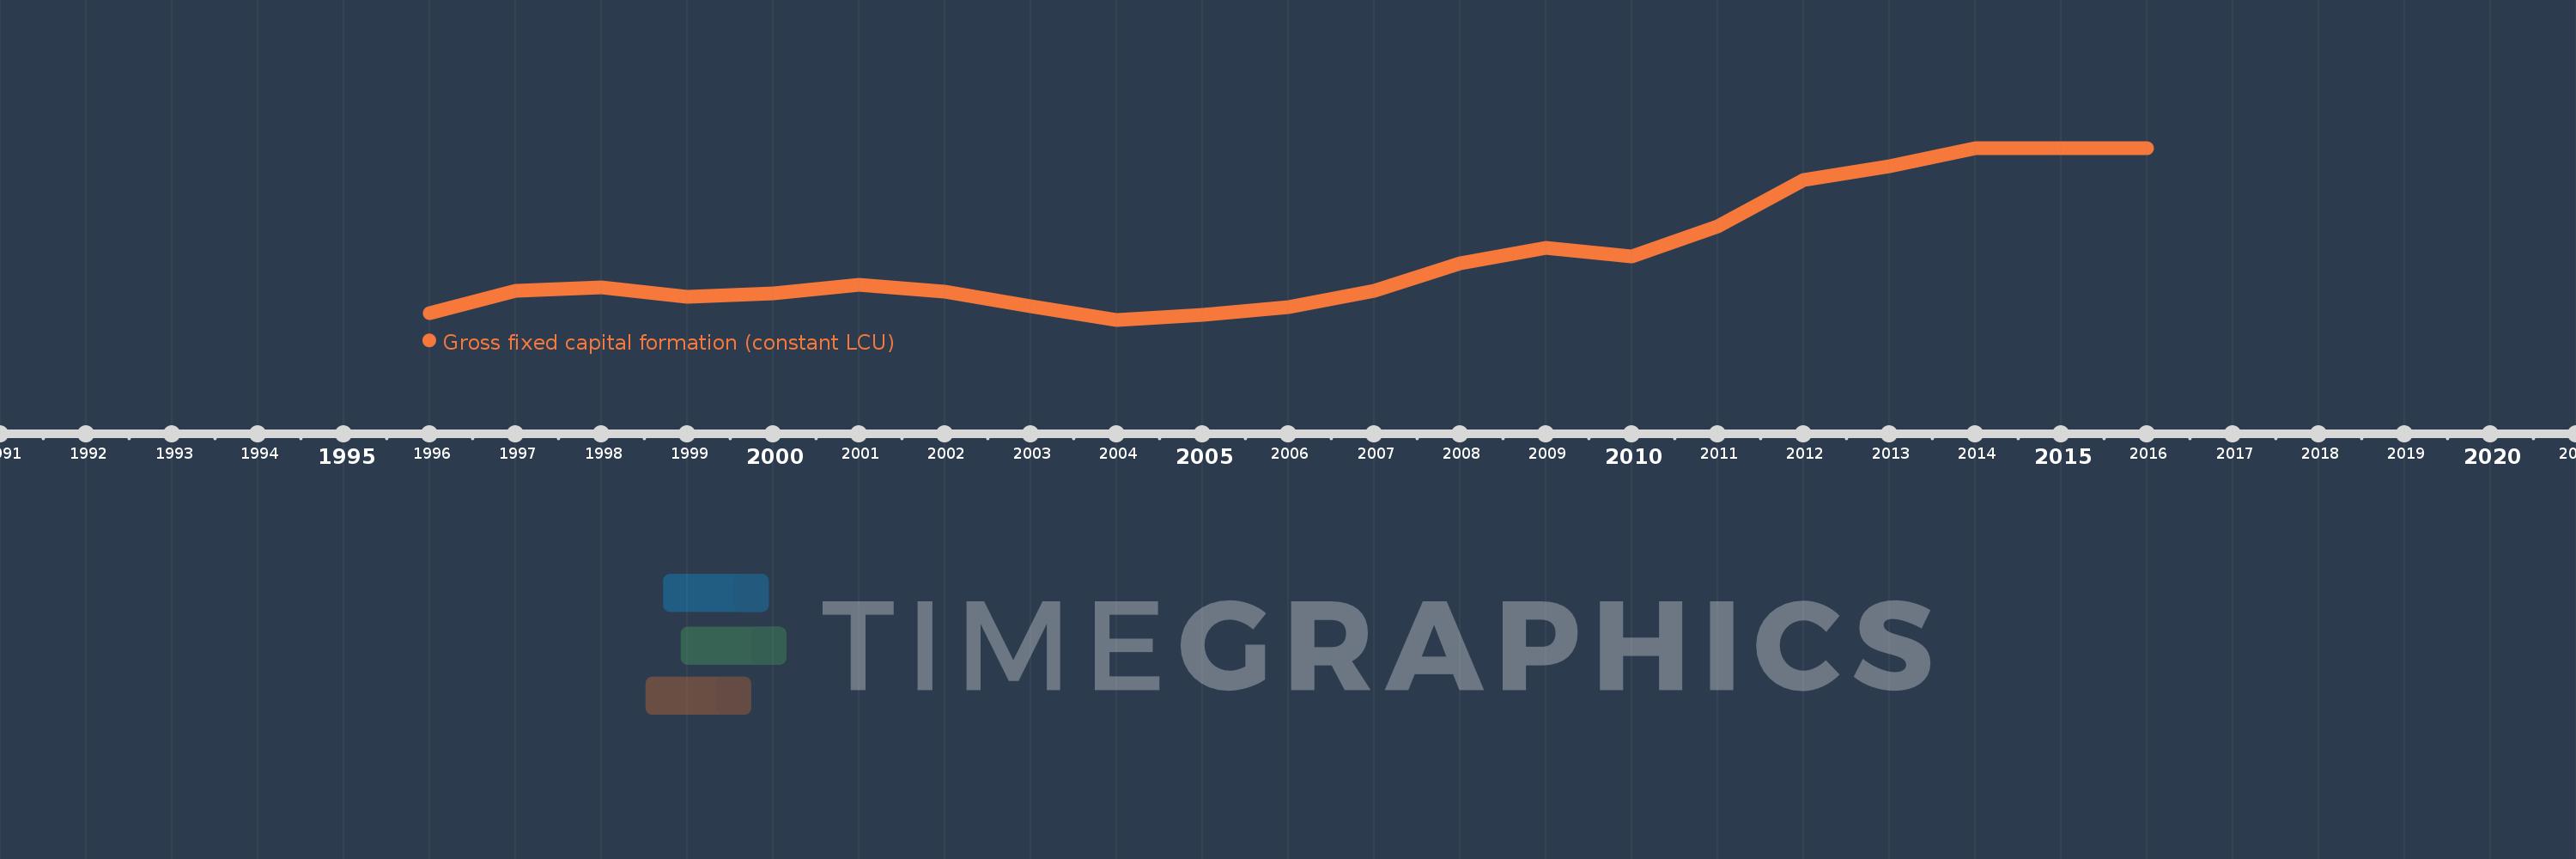
Gross fixed capital formation (constant LCU)
2016,2015,2014,2013,2012,2011,2010,2009,2008,2007,2006,2005,2004,2003,2002,2001,2000,1999,1998,1997,1996
This statistics in other country:
AlbaniaAlgeriaAngolaAntigua and BarbudaArgentinaArmeniaAustraliaAustriaAzerbaijanBahamas, TheBahrainBangladeshBarbadosBelarusBelgiumBelizeBeninBhutanBoliviaBosnia and HerzegovinaBotswanaBrazilBrunei DarussalamBulgariaBurkina FasoBurundiCabo VerdeCambodiaCameroonCanadaChadChileChinaColombiaComorosCongo, Dem. Rep.Congo, Rep.Costa RicaCote d'IvoireCroatiaCubaCyprusCzech RepublicDenmarkDjiboutiDominican RepublicEcuadorEgypt, Arab Rep.El SalvadorEquatorial GuineaEritreaEstoniaEthiopiaFinlandFranceGabonGambia, TheGeorgiaGermanyGhanaGreeceGuatemalaGuineaGuinea-BissauHaitiHondurasHong Kong SAR, ChinaHungaryIcelandIndiaIndonesiaIran, Islamic Rep.IrelandIsraelItalyJamaicaJapanJordanKazakhstanKenyaKorea, Rep.KosovoKyrgyz RepublicLao PDRLatviaLebanonLiberiaLithuaniaLuxembourgMacao SAR, ChinaMacedonia, FYRMadagascarMalawiMalaysiaMaliMaltaMauritaniaMauritiusMexicoMoldovaMongoliaMontenegroMoroccoMozambiqueNamibiaNepalNetherlandsNew ZealandNicaraguaNigerNigeriaNorwayOmanPakistanPanamaPapua New GuineaParaguayPeruPhilippinesPolandPortugalPuerto RicoRomaniaRussian FederationRwandaSaudi ArabiaSenegalSerbiaSeychellesSierra LeoneSingaporeSlovak RepublicSloveniaSomaliaSouth AfricaSouth SudanSpainSri LankaSudanSurinameSwazilandSwedenSwitzerlandSyrian Arab RepublicTajikistanTanzaniaThailandTimor-LesteTogoTrinidad and TobagoTunisiaTurkeyUgandaUkraineUnited Arab EmiratesUnited KingdomUnited StatesUruguayUzbekistanVanuatuVenezuela, RBVietnamWest Bank and GazaZambiaZimbabwe Timeline:
This timeline shows a graph from 1996 to 2016 of Israel. No data until 1995. Number of actual observations by date: 21.
Source name:
World Development Indicators
Source organization:
World Bank national accounts data, and OECD National Accounts data files.
Categories, topics:
Economy & Growth
Last updated:
apr 23, 2017
Indicators value changes by year
Minimum:
119.463 bln
jan 1, 2004
Maximum:
204.119 bln
jan 1, 2016
At the date of observation
Value
Absolute change
Change from previous value
jan 1, 1996
122.67 bln
+122.67 bln
0.0%
jan 1, 1997
133.887 bln
+11.216 bln
9.14%
jan 1, 1998
135.359 bln
+1.473 bln
1.1%
jan 1, 1999
130.665 bln
-4.694 bln
-3.47%
jan 1, 2000
132.646 bln
+1.981 bln
1.52%
jan 1, 2001
136.636 bln
+3.99 bln
3.01%
jan 1, 2002
133.33 bln
-3.307 bln
-2.42%
jan 1, 2003
126.116 bln
-7.213 bln
-5.41%
jan 1, 2004
119.463 bln
-6.653 bln
-5.28%
jan 1, 2005
121.797 bln
+2.334 bln
1.95%
jan 1, 2006
125.749 bln
+3.951 bln
3.24%
jan 1, 2007
133.912 bln
+8.163 bln
6.49%
jan 1, 2008
147.453 bln
+13.541 bln
10.11%
jan 1, 2009
155.01 bln
+7.557 bln
5.13%
jan 1, 2010
150.55 bln
-4.461 bln
-2.88%
jan 1, 2011
165.566 bln
+15.016 bln
9.97%
jan 1, 2012
188.336 bln
+22.77 bln
13.75%
jan 1, 2013
195.139 bln
+6.803 bln
3.61%
jan 1, 2014
203.91 bln
+8.771 bln
4.49%
jan 1, 2015
203.941 bln
+31.0 mln
0.02%
jan 1, 2016
204.119 bln
+178.0 mln
0.09%
Ranking of countries by current statistics by years


Comments: