29
/
en
AIzaSyAYiBZKx7MnpbEhh9jyipgxe19OcubqV5w
April 1, 2024
279150
Uzbekistan
UZB
true
2
1
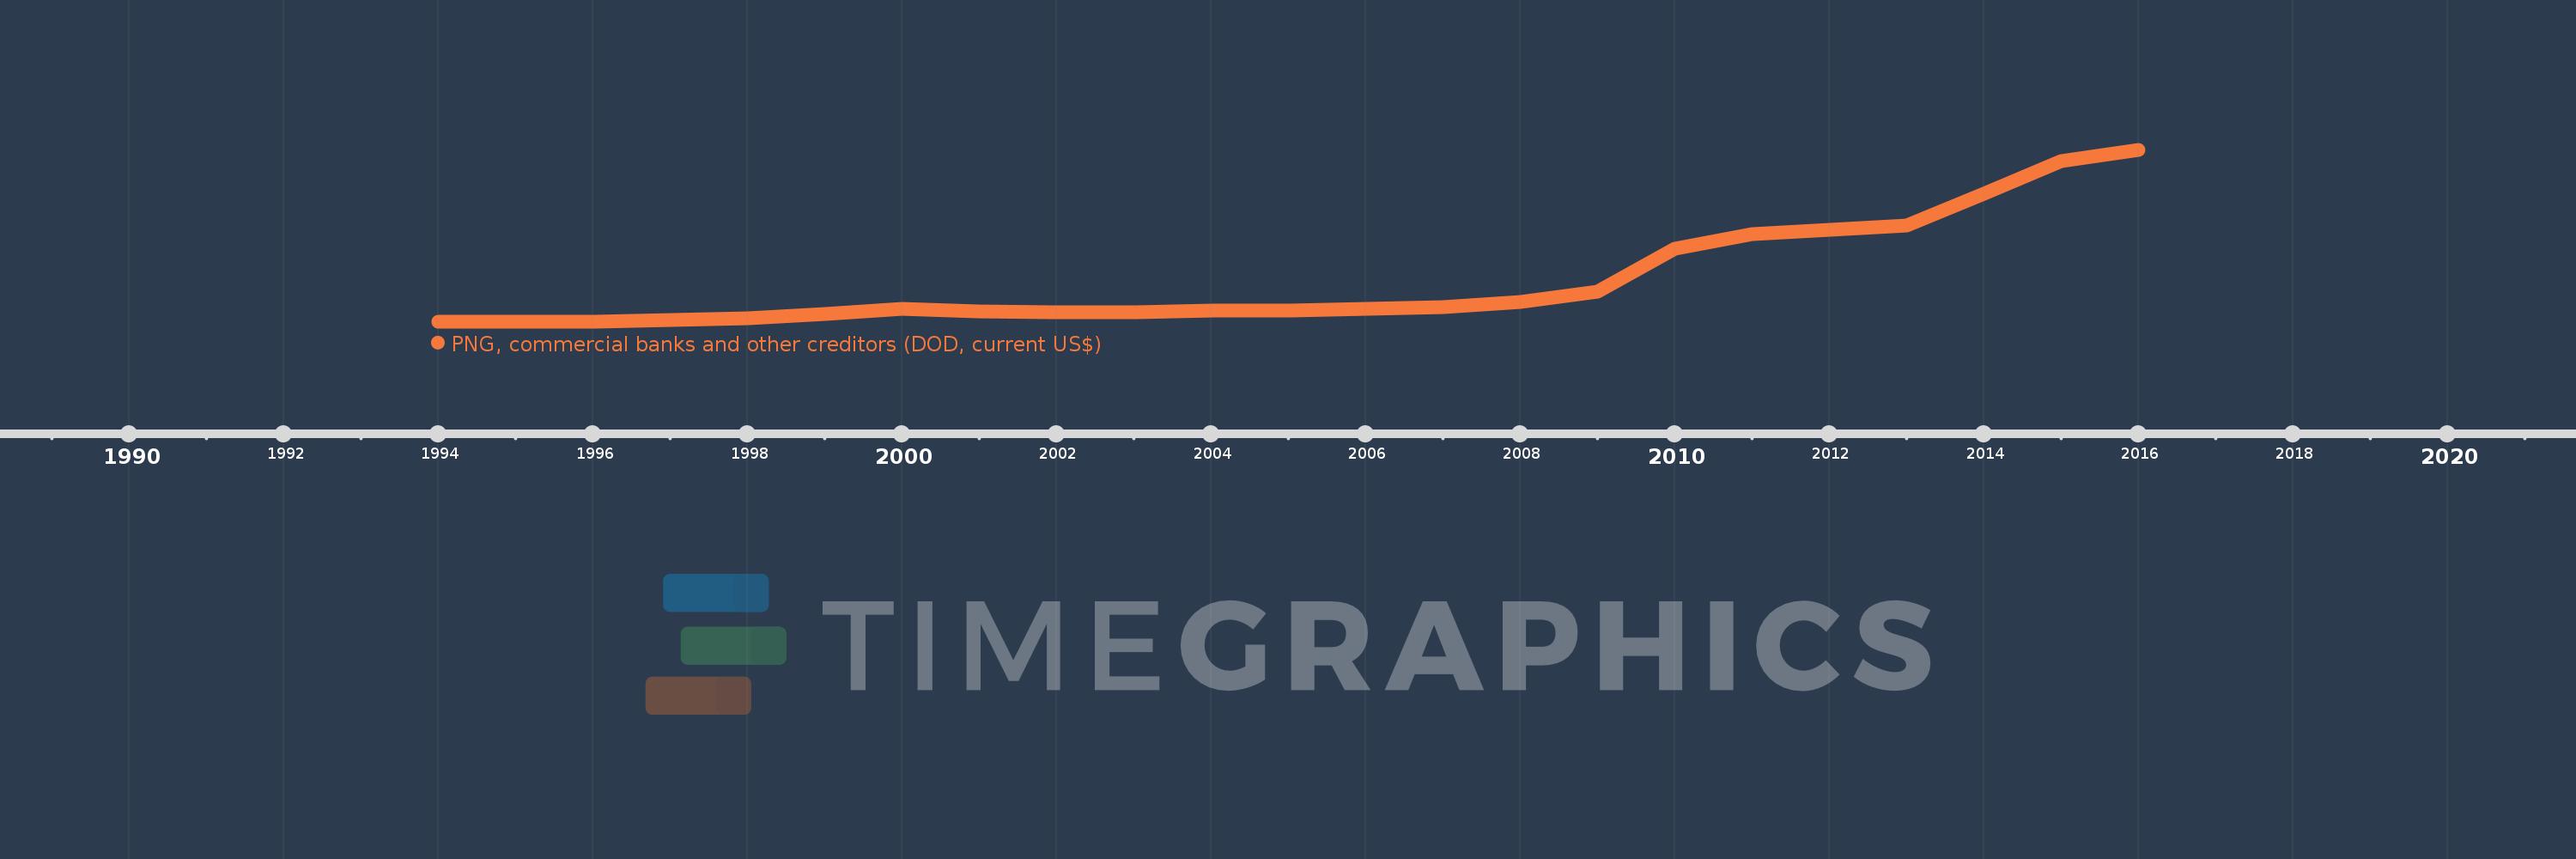
PNG, commercial banks and other creditors (DOD, current US$)
2016,2015,2014,2013,2012,2011,2010,2009,2008,2007,2006,2005,2004,2003,2002,2001,2000,1999,1998,1997,1996,1995,1994
This statistics in other country:
Timeline:
This timeline shows a graph from 1994 to 2016 of Uzbekistan. No data until 1993. Number of actual observations by date: 23.
Source name:
World Development Indicators
Source organization:
World Bank, International Debt Statistics.
Categories, topics:
External Debt
Last updated:
apr 23, 2017
Indicators value changes by year
Minimum:
207.0K
jan 1, 1994
Maximum:
7.315 bln
jan 1, 2016
At the date of observation
Value
Absolute change
Change from previous value
jan 1, 1994
207.0K
+207.0K
0.0%
jan 1, 1995
3.754 mln
+3.547 mln
1.71K%
jan 1, 1996
14.51 mln
+10.756 mln
286.52%
jan 1, 1997
67.43 mln
+52.92 mln
364.71%
jan 1, 1998
166.95 mln
+99.52 mln
147.59%
jan 1, 1999
323.746 mln
+156.796 mln
93.92%
jan 1, 2000
546.205 mln
+222.459 mln
68.71%
jan 1, 2001
466.616 mln
-79.589 mln
-14.57%
jan 1, 2002
401.017 mln
-65.599 mln
-14.06%
jan 1, 2003
397.147 mln
-3.87 mln
-0.97%
jan 1, 2004
493.023 mln
+95.876 mln
24.14%
jan 1, 2005
503.184 mln
+10.161 mln
2.06%
jan 1, 2006
541.829 mln
+38.645 mln
7.68%
jan 1, 2007
617.18 mln
+75.351 mln
13.91%
jan 1, 2008
862.621 mln
+245.441 mln
39.77%
jan 1, 2009
1.306 bln
+443.841 mln
51.45%
jan 1, 2010
3.117 bln
+1.811 bln
138.61%
jan 1, 2011
3.73 bln
+613.051 mln
19.67%
jan 1, 2012
3.91 bln
+179.548 mln
4.81%
jan 1, 2013
4.125 bln
+214.838 mln
5.49%
jan 1, 2014
5.478 bln
+1.353 bln
32.81%
jan 1, 2015
6.864 bln
+1.386 bln
25.3%
jan 1, 2016
7.315 bln
+450.425 mln
6.56%
Ranking of countries by current statistics by years


Comments: