29
/
en
AIzaSyAYiBZKx7MnpbEhh9jyipgxe19OcubqV5w
April 1, 2024
230232
Russian Federation
RUS
true
2
1
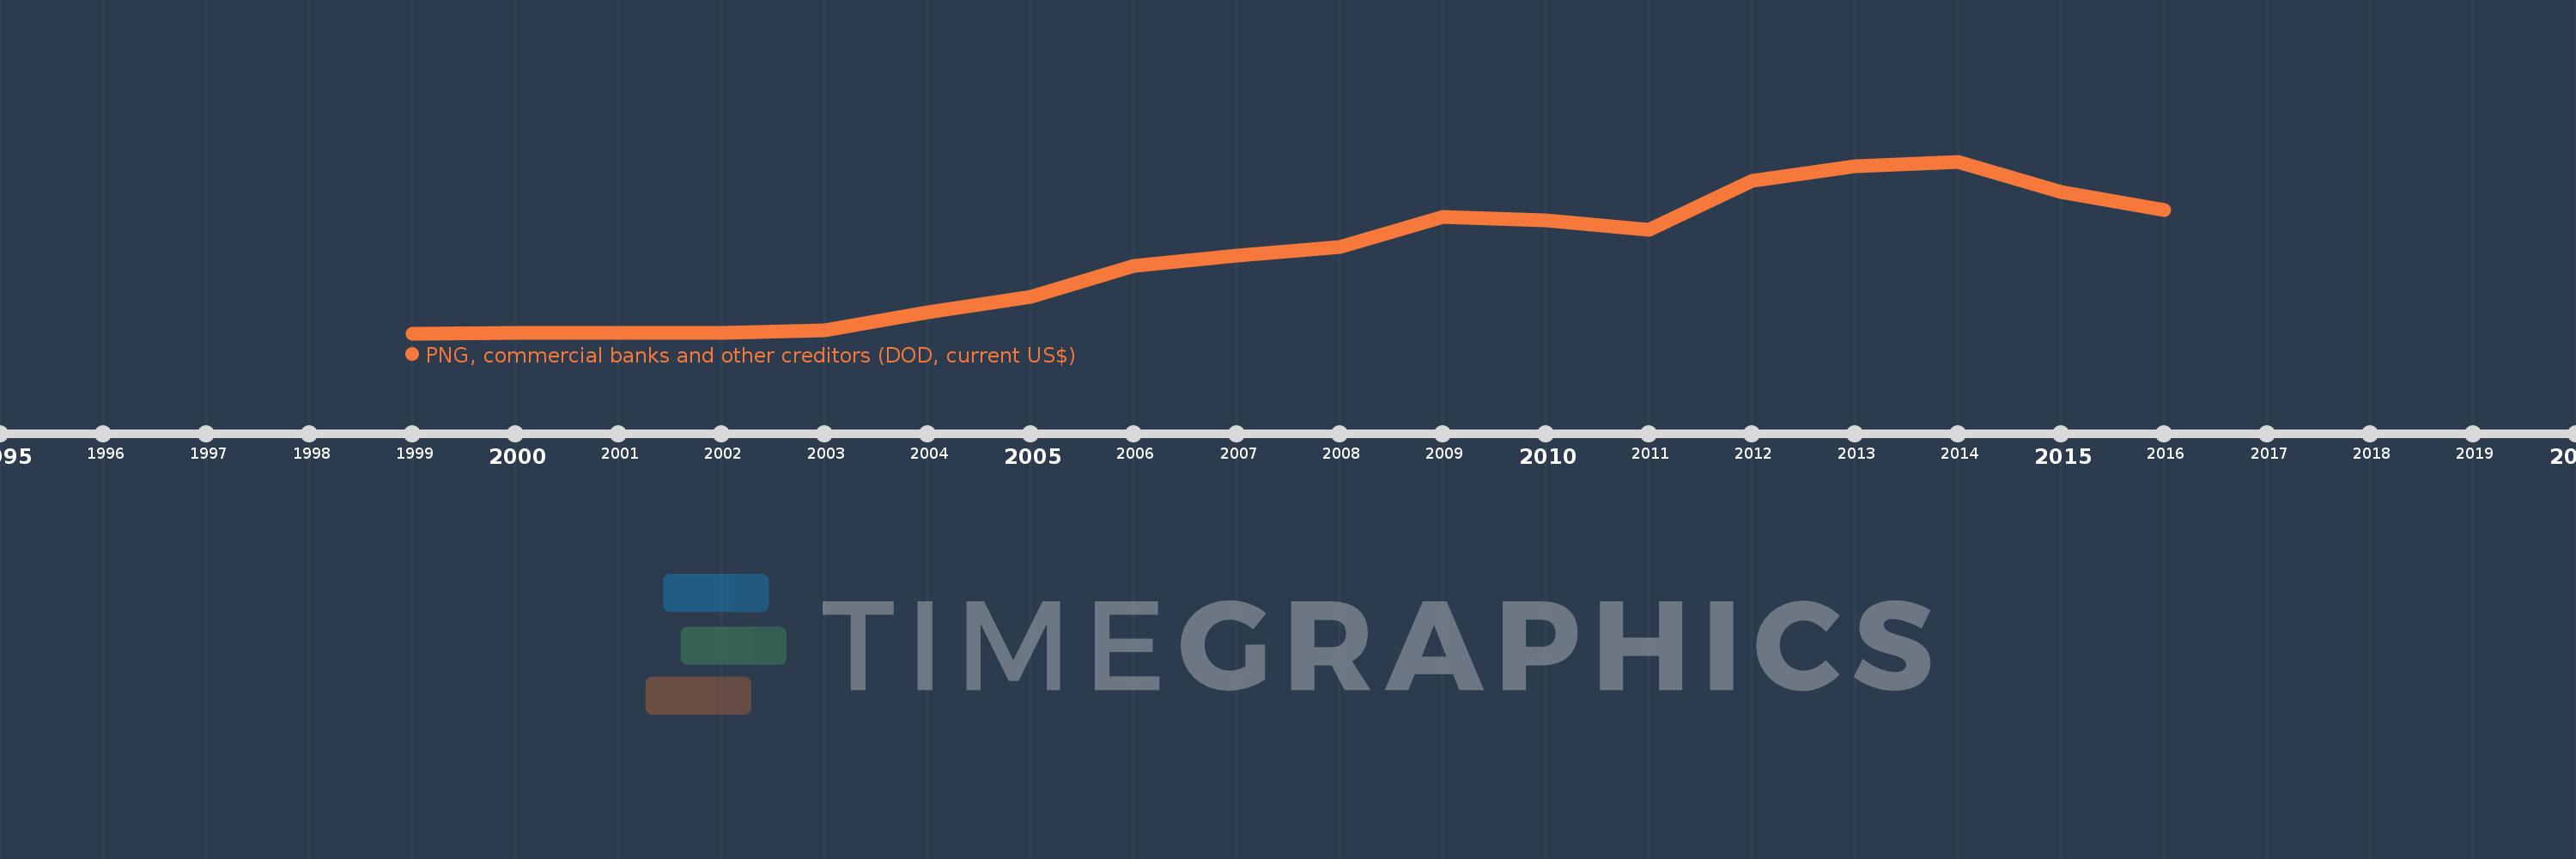
PNG, commercial banks and other creditors (DOD, current US$)
2016,2015,2014,2013,2012,2011,2010,2009,2008,2007,2006,2005,2004,2003,2002,2001,2000,1999
This statistics in other country:
Timeline:
This timeline shows a graph from 1999 to 2016 of Russian Federation. No data until 1998. Number of actual observations by date: 18.
Source name:
World Development Indicators
Source organization:
World Bank, International Debt Statistics.
Categories, topics:
External Debt
Last updated:
apr 23, 2017
Indicators value changes by year
Minimum:
19.974 bln
jan 1, 1999
Maximum:
287.524 bln
jan 1, 2014
At the date of observation
Value
Absolute change
Change from previous value
jan 1, 1999
19.974 bln
+19.974 bln
0.0%
jan 1, 2000
20.413 bln
+438.947 mln
2.2%
jan 1, 2001
20.35 bln
-62.512 mln
-0.31%
jan 1, 2002
20.592 bln
+241.836 mln
1.19%
jan 1, 2003
23.989 bln
+3.397 bln
16.5%
jan 1, 2004
52.52 bln
+28.532 bln
118.94%
jan 1, 2005
76.705 bln
+24.184 bln
46.05%
jan 1, 2006
125.633 bln
+48.928 bln
63.79%
jan 1, 2007
141.415 bln
+15.782 bln
12.56%
jan 1, 2008
154.698 bln
+13.283 bln
9.39%
jan 1, 2009
200.762 bln
+46.065 bln
29.78%
jan 1, 2010
196.292 bln
-4.47 bln
-2.23%
jan 1, 2011
181.173 bln
-15.119 bln
-7.7%
jan 1, 2012
257.499 bln
+76.326 bln
42.13%
jan 1, 2013
280.09 bln
+22.592 bln
8.77%
jan 1, 2014
287.524 bln
+7.433 bln
2.65%
jan 1, 2015
239.821 bln
-47.703 bln
-16.59%
jan 1, 2016
211.915 bln
-27.905 bln
-11.64%
Ranking of countries by current statistics by years


Comments: