29
/
en
AIzaSyAYiBZKx7MnpbEhh9jyipgxe19OcubqV5w
April 1, 2024
65212
Albania
ALB
true
2
1
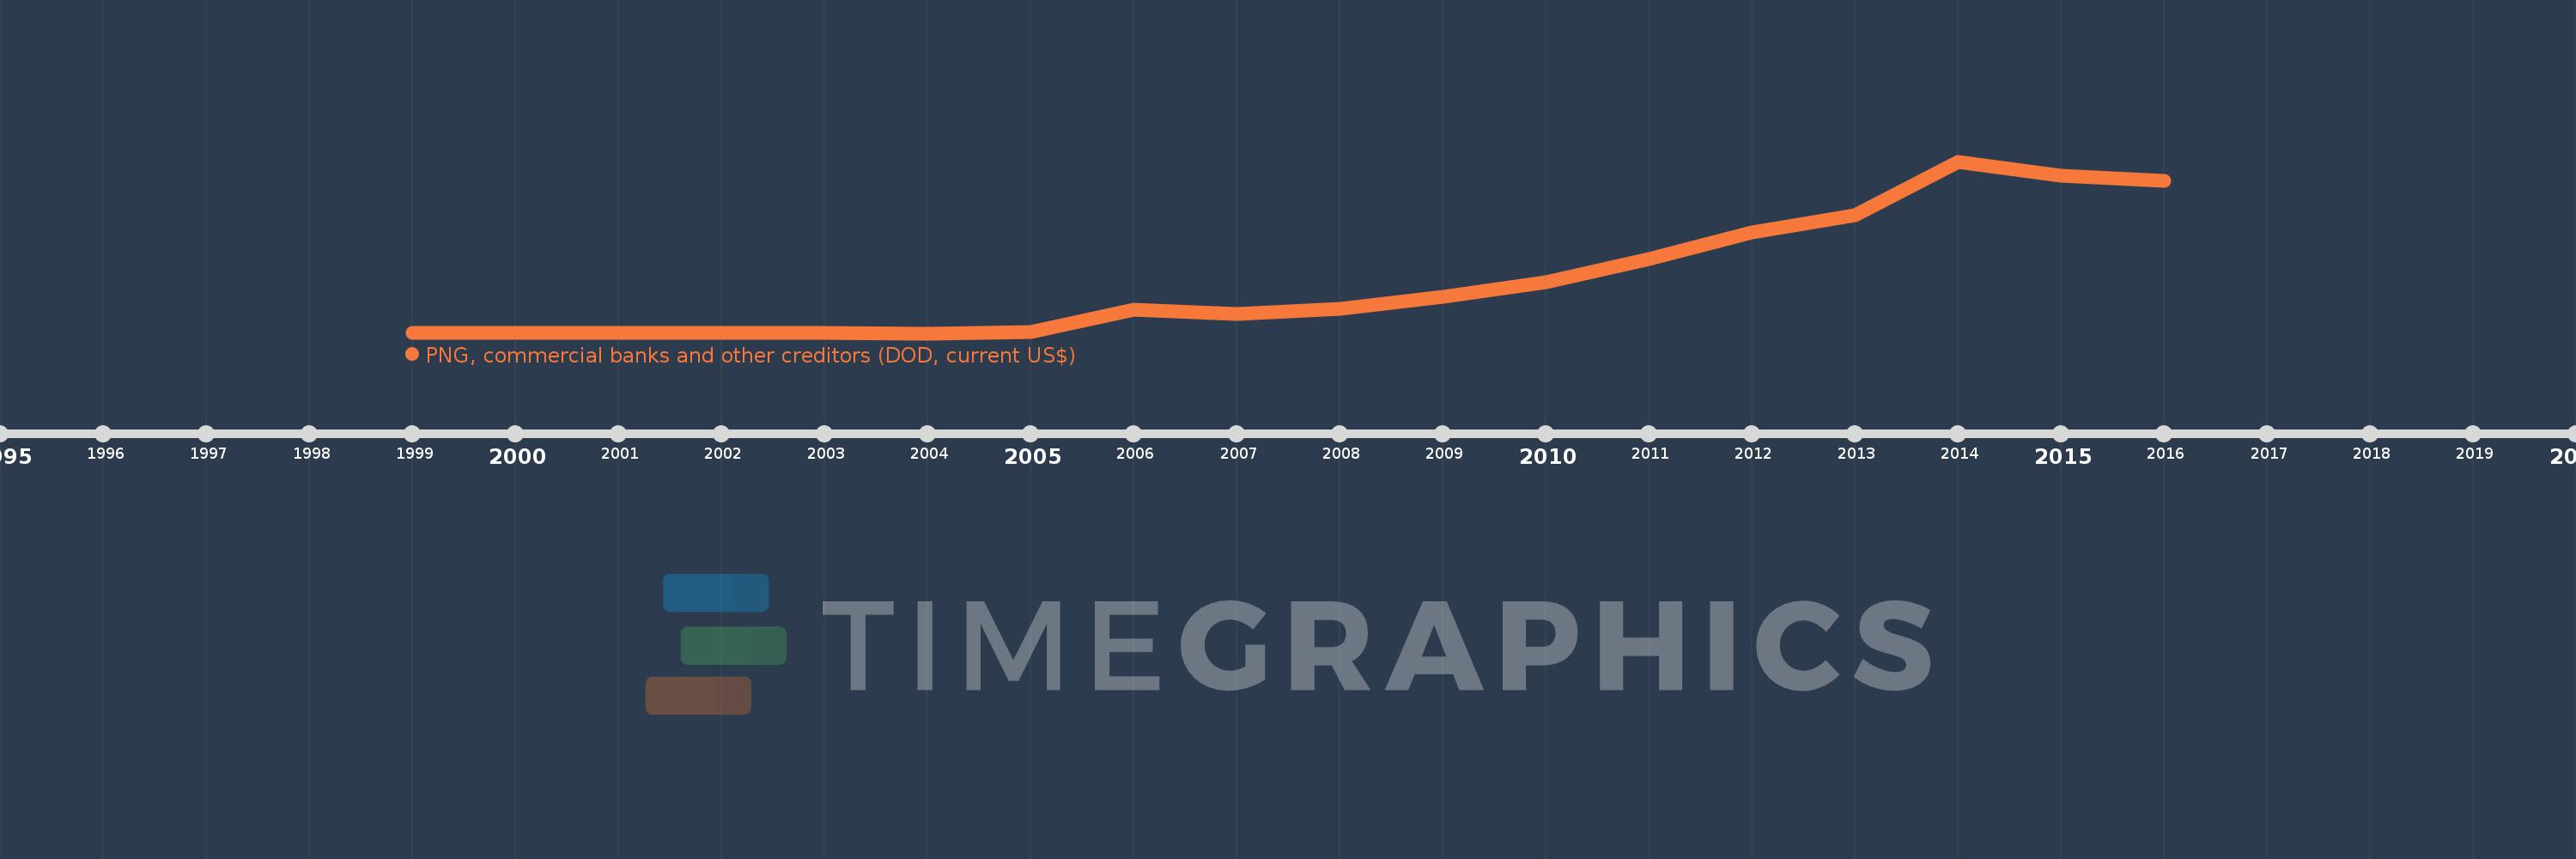
PNG, commercial banks and other creditors (DOD, current US$)
2016,2015,2014,2013,2012,2011,2010,2009,2008,2007,2006,2005,2004,2003,2002,2001,2000,1999
This statistics in other country:
Timeline:
This timeline shows a graph from 1999 to 2016 of Albania. No data until 1998. Number of actual observations by date: 18.
Source name:
World Development Indicators
Source organization:
World Bank, International Debt Statistics.
Categories, topics:
External Debt
Last updated:
apr 23, 2017
Indicators value changes by year
Minimum:
9.762 mln
jan 1, 2004
Maximum:
2.943 bln
jan 1, 2014
At the date of observation
Value
Absolute change
Change from previous value
jan 1, 1999
18.0 mln
+18.0 mln
0.0%
jan 1, 2000
16.0 mln
-2.0 mln
-11.11%
jan 1, 2001
16.0 mln
0.0
0.0%
jan 1, 2002
12.0 mln
-4.0 mln
-25.0%
jan 1, 2003
12.345 mln
+345.0K
2.88%
jan 1, 2004
9.762 mln
-2.583 mln
-20.92%
jan 1, 2005
34.019 mln
+24.257 mln
248.48%
jan 1, 2006
413.243 mln
+379.224 mln
1.11K%
jan 1, 2007
338.616 mln
-74.627 mln
-18.06%
jan 1, 2008
434.878 mln
+96.262 mln
28.43%
jan 1, 2009
638.29 mln
+203.412 mln
46.77%
jan 1, 2010
883.582 mln
+245.292 mln
38.43%
jan 1, 2011
1.285 bln
+401.287 mln
45.42%
jan 1, 2012
1.732 bln
+447.328 mln
34.82%
jan 1, 2013
2.027 bln
+295.046 mln
17.03%
jan 1, 2014
2.943 bln
+915.599 mln
45.16%
jan 1, 2015
2.705 bln
-238.06 mln
-8.09%
jan 1, 2016
2.607 bln
-97.386 mln
-3.6%
Ranking of countries by current statistics by years


Comments: