29
/
en
AIzaSyAYiBZKx7MnpbEhh9jyipgxe19OcubqV5w
April 1, 2024
277870
Uruguay
URY
true
2
1
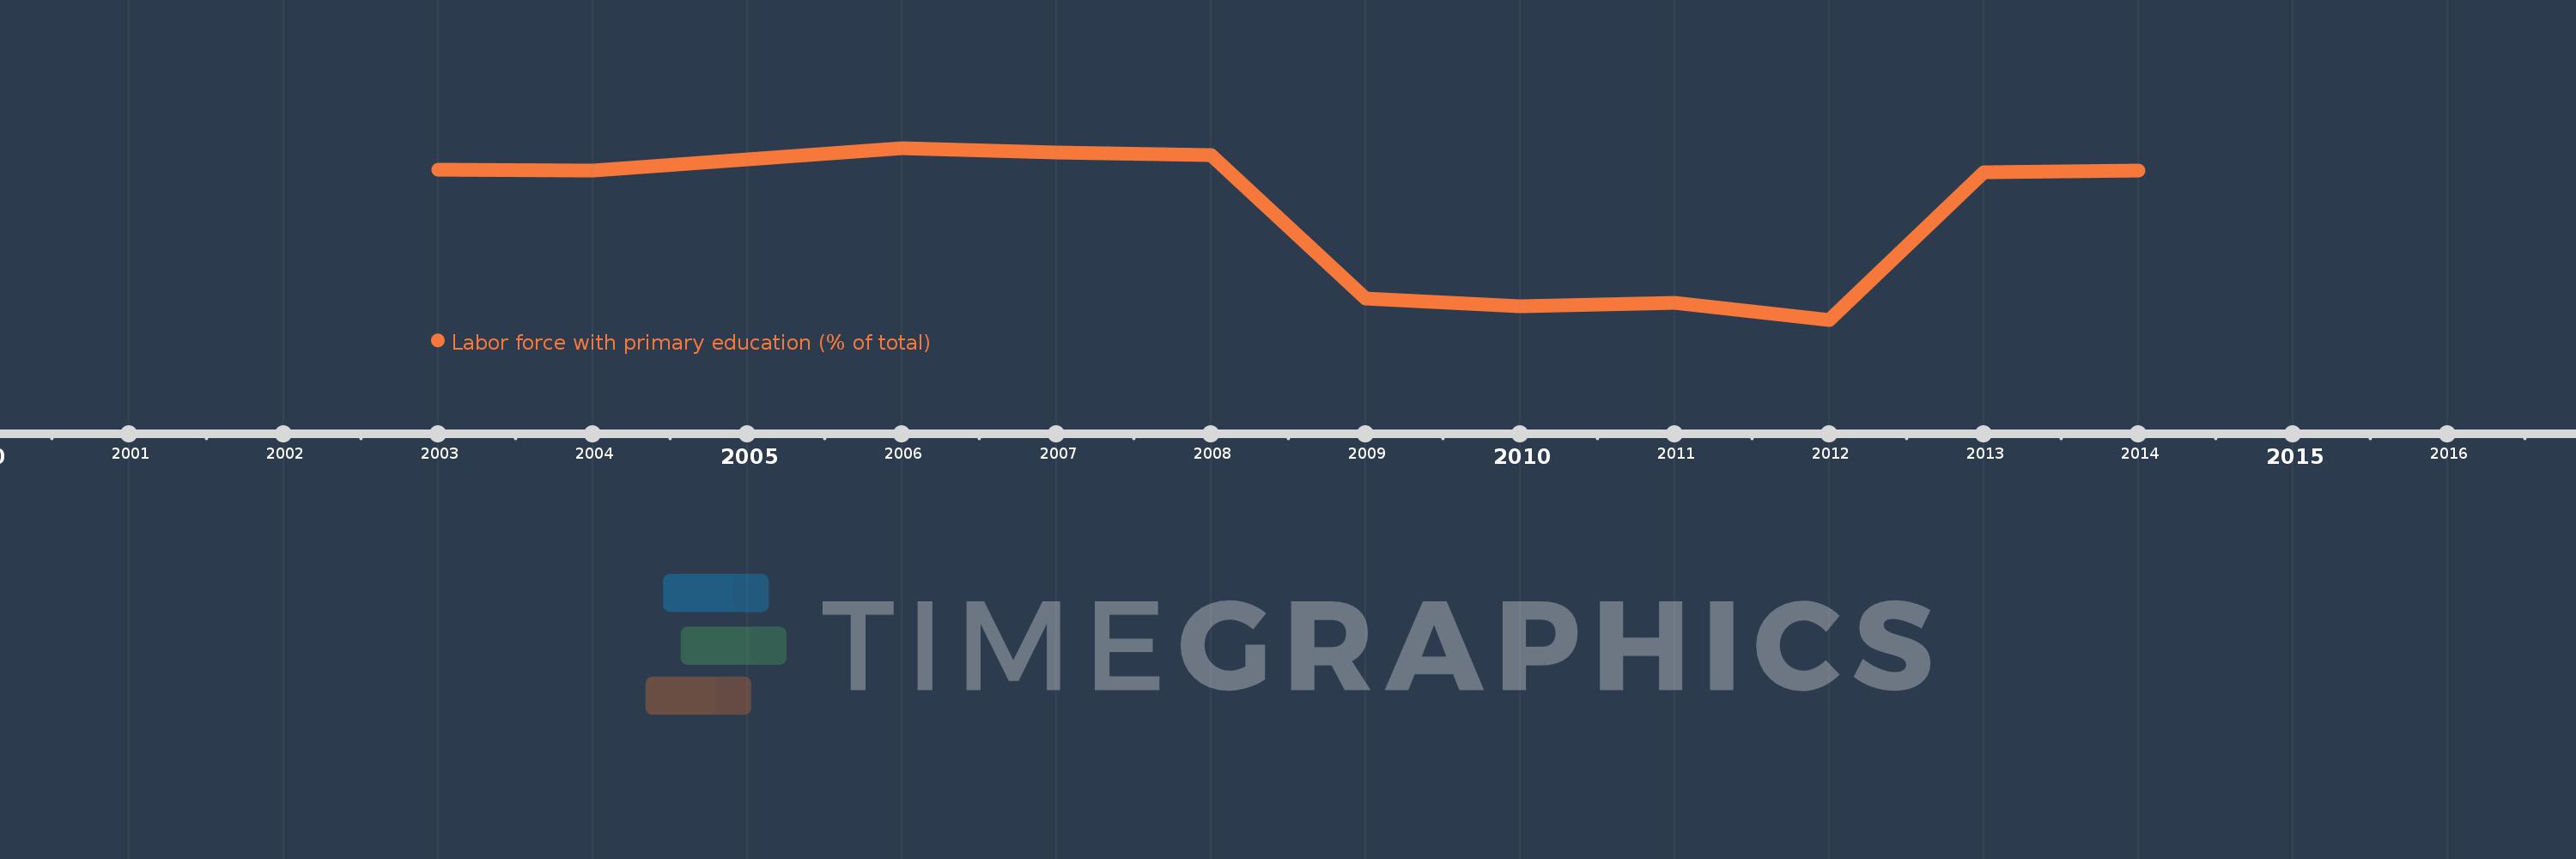
Labor force with primary education (% of total)
2014,2013,2012,2011,2010,2009,2008,2007,2006,2004,2003
This statistics in other country:
Timeline:
This timeline shows a graph from 2003 to 2014 of Uruguay. No data until 2002. Number of actual observations by date: 11.
Source name:
World Development Indicators
Source organization:
International Labour Organization, Key Indicators of the Labour Market database.
Categories, topics:
Education, Social Protection & Labor
Last updated:
apr 23, 2017
Indicators value changes by year
At the date of observation
Value
Absolute change
Change from previous value
jan 1, 2003
51.1
+51.1
0.0%
jan 1, 2004
50.9
-0.2
-0.39%
jan 1, 2006
55.2
+4.3
8.45%
jan 1, 2007
54.3
-0.9
-1.63%
jan 1, 2008
53.8
-0.5
-0.92%
jan 1, 2009
27.0
-26.8
-49.81%
jan 1, 2010
25.6
-1.4
-5.19%
jan 1, 2011
26.3
+0.7
2.73%
jan 1, 2012
23.1
-3.2
-12.17%
jan 1, 2013
50.6
+27.5
119.05%
jan 1, 2014
50.9
+0.3
0.59%
Ranking of countries by current statistics by years


Comments: