29
/
en
AIzaSyAYiBZKx7MnpbEhh9jyipgxe19OcubqV5w
April 1, 2024
234807
Saudi Arabia
SAU
true
2
1
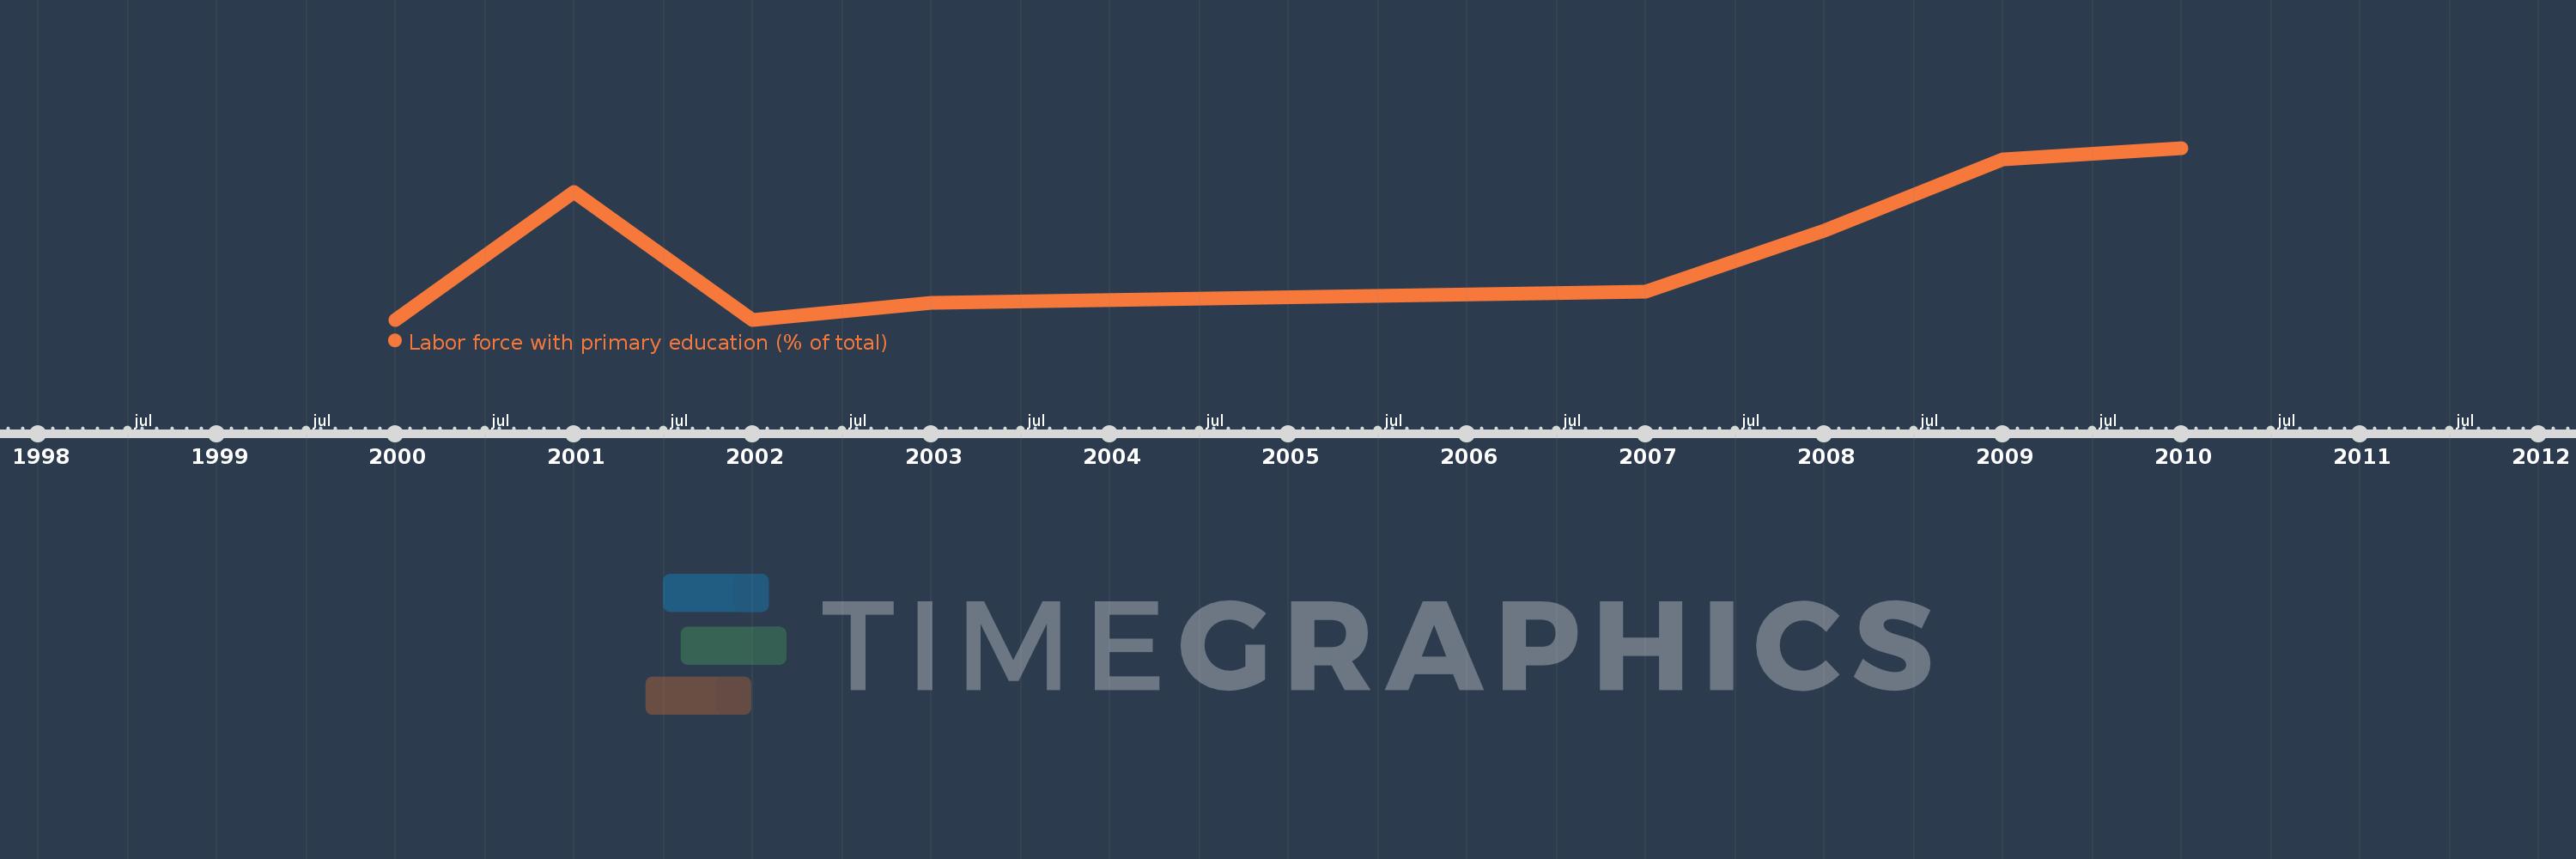
Labor force with primary education (% of total)
2010,2009,2008,2007,2003,2002,2001,2000
This statistics in other country:
Timeline:
This timeline shows a graph from 2000 to 2010 of Saudi Arabia. No data until 1999. Number of actual observations by date: 8.
Source name:
World Development Indicators
Source organization:
International Labour Organization, Key Indicators of the Labour Market database.
Categories, topics:
Education, Social Protection & Labor
Last updated:
apr 23, 2017
Indicators value changes by year
At the date of observation
Value
Absolute change
Change from previous value
jan 1, 2000
31.6
+31.6
0.0%
jan 1, 2001
33.9
+2.3
7.28%
jan 1, 2002
31.6
-2.3
-6.78%
jan 1, 2003
31.9
+0.3
0.95%
jan 1, 2007
32.1
+0.2
0.63%
jan 1, 2008
33.2
+1.1
3.43%
jan 1, 2009
34.5
+1.3
3.92%
jan 1, 2010
34.7
+0.2
0.58%
Ranking of countries by current statistics by years


Comments: