29
/
en
AIzaSyAYiBZKx7MnpbEhh9jyipgxe19OcubqV5w
April 1, 2024
33574
European Union
EUU
false
2
1
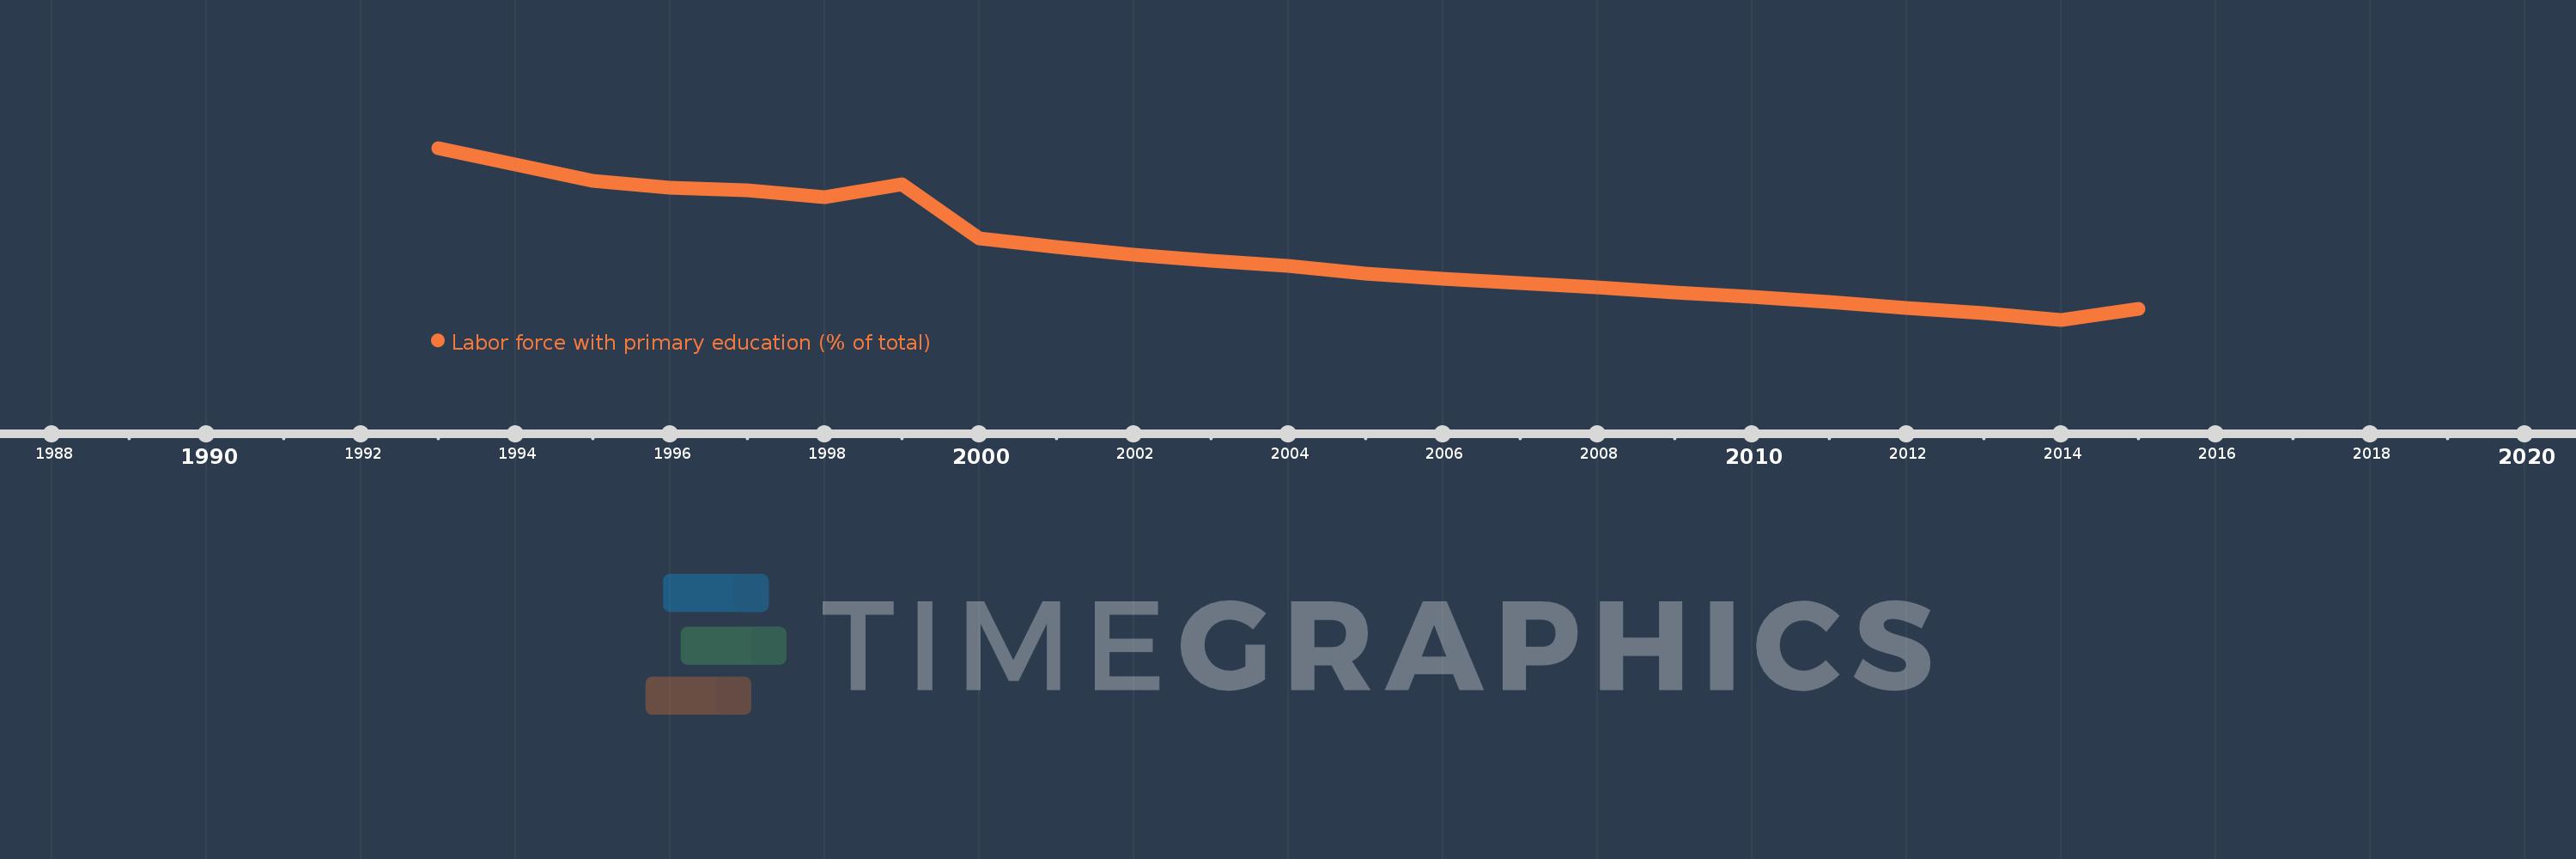
Labor force with primary education (% of total)
2015,2014,2013,2012,2011,2010,2009,2008,2007,2006,2005,2004,2003,2002,2001,2000,1999,1998,1997,1996,1995,1994,1993
This statistics in other country:
Timeline:
This timeline shows a graph from 1993 to 2015 of European Union. No data until 1992. Number of actual observations by date: 23.
Source name:
World Development Indicators
Source organization:
International Labour Organization, Key Indicators of the Labour Market database.
Categories, topics:
Education, Social Protection & Labor
Last updated:
apr 23, 2017
Indicators value changes by year
Minimum:
19.013
jan 1, 2014
Maximum:
40.496
jan 1, 1993
At the date of observation
Value
Absolute change
Change from previous value
jan 1, 1993
40.496
+40.496
0.0%
jan 1, 1994
38.436
-2.059
-5.08%
jan 1, 1995
36.361
-2.075
-5.4%
jan 1, 1996
35.521
-0.84
-2.31%
jan 1, 1997
35.249
-0.273
-0.77%
jan 1, 1998
34.337
-0.912
-2.59%
jan 1, 1999
35.964
+1.627
4.74%
jan 1, 2000
29.136
-6.829
-18.99%
jan 1, 2001
28.124
-1.011
-3.47%
jan 1, 2002
27.099
-1.026
-3.65%
jan 1, 2003
26.402
-0.697
-2.57%
jan 1, 2004
25.724
-0.678
-2.57%
jan 1, 2005
24.741
-0.982
-3.82%
jan 1, 2006
24.12
-0.621
-2.51%
jan 1, 2007
23.548
-0.572
-2.37%
jan 1, 2008
23.083
-0.464
-1.97%
jan 1, 2009
22.428
-0.655
-2.84%
jan 1, 2010
21.846
-0.581
-2.59%
jan 1, 2011
21.225
-0.622
-2.85%
jan 1, 2012
20.475
-0.75
-3.53%
jan 1, 2013
19.861
-0.614
-3.0%
jan 1, 2014
19.013
-0.848
-4.27%
jan 1, 2015
20.341
+1.328
6.98%
Ranking of countries by current statistics by years


Comments: