Download This statistics in other country:
Timeline:
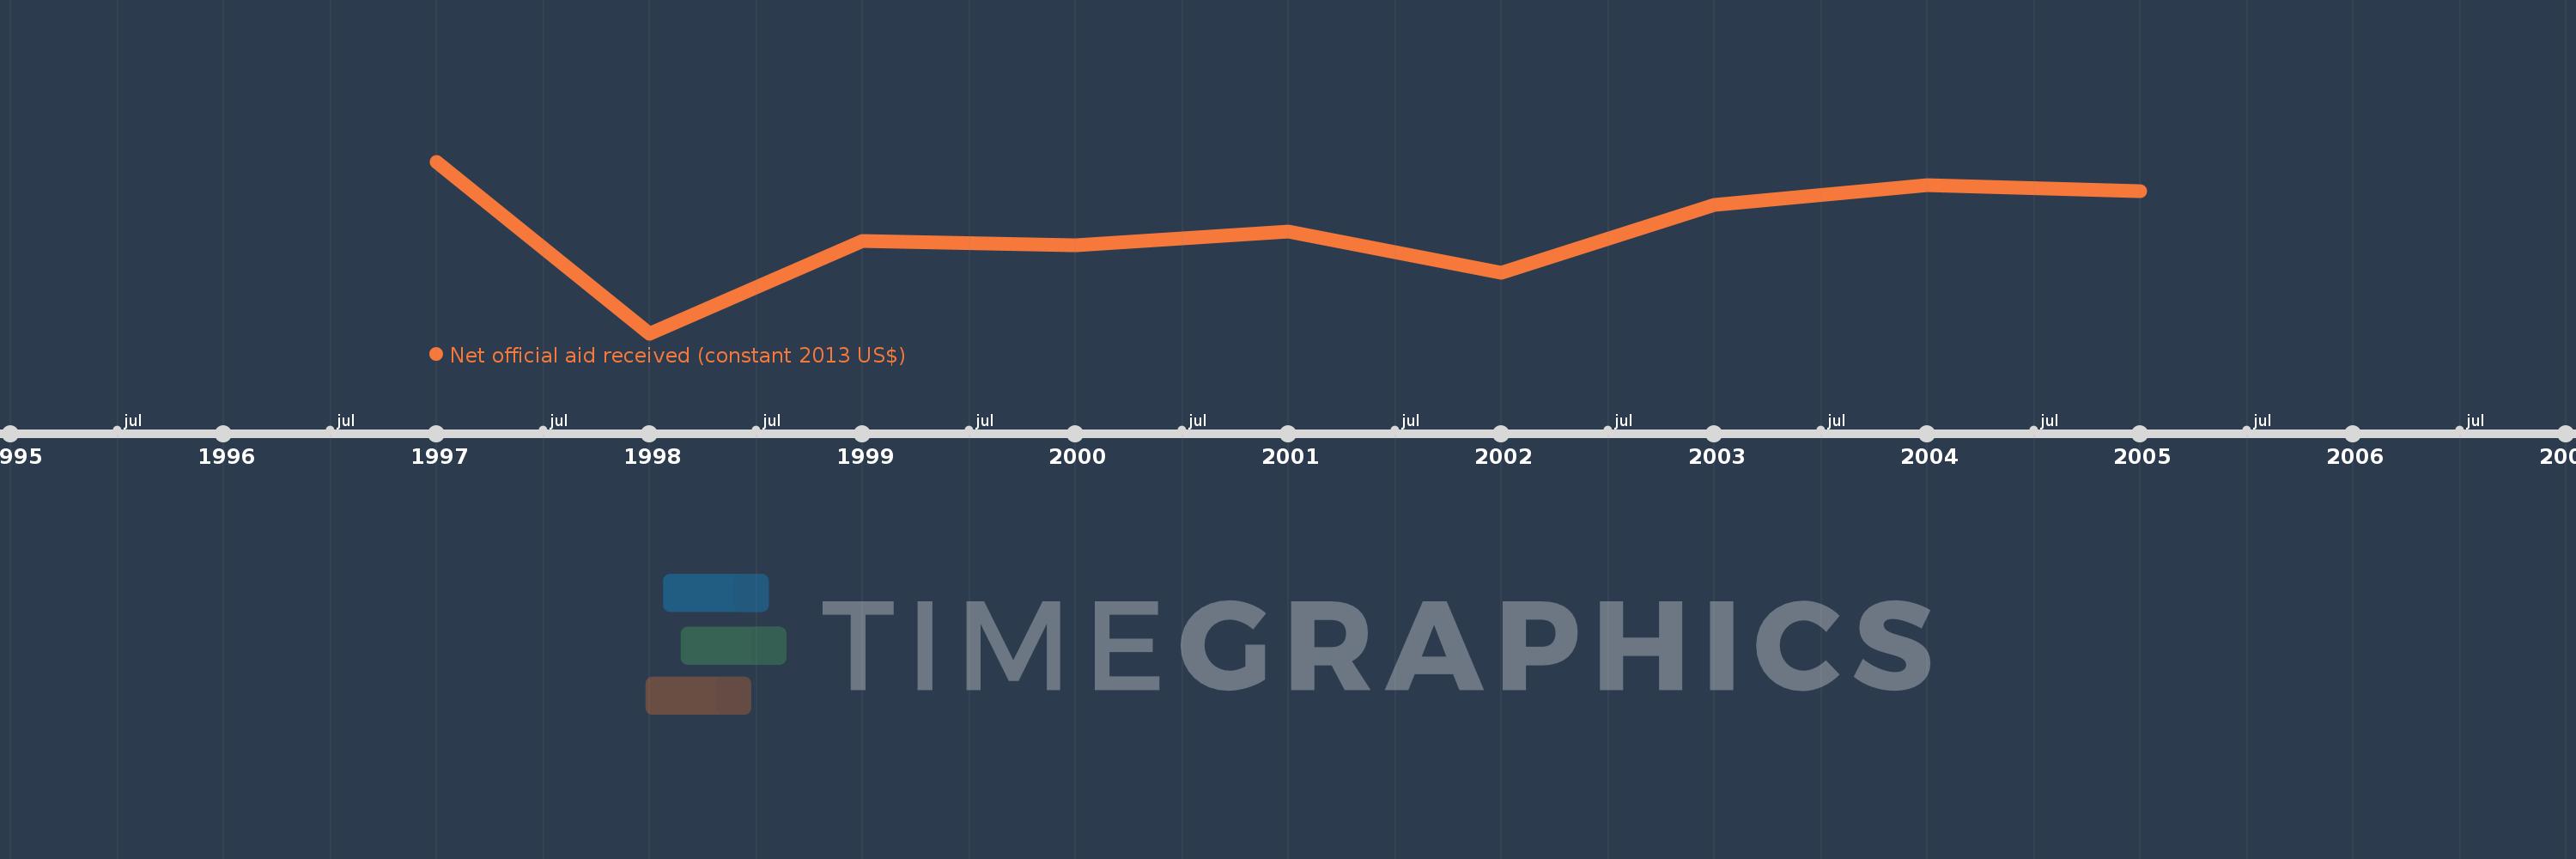
This timeline shows a graph from 1997 to 2005 of United Arab Emirates. No data until 1996. Number of actual observations by date: 9.
Source name:
World Development Indicators
Source organization:
Development Assistance Committee of the Organisation for Economic Co-operation and Development, Geographical Distribution of Financial Flows to Developing Countries, Development Co-operation Report, and International Development Statistics database. Data are available online at: www.oecd.org/dac/stats/idsonline.
Categories, topics:
Aid Effectiveness
Last updated:
apr 23, 2017
Indicators value changes by year
Minimum:
2.5 mln
jan 1, 1998
Maximum:
7.28 mln
jan 1, 1997
At the date of observation
Value
Absolute change
Change from the previous value
jan 1, 1997
7.28 mln
+7.28 mln
0.0%
jan 1, 1998
2.5 mln
-4.78 mln
-65.66%
jan 1, 1999
5.08 mln
+2.58 mln
103.2%
jan 1, 2000
4.95 mln
-130.0K
-2.56%
jan 1, 2001
5.33 mln
+380.0K
7.68%
jan 1, 2002
4.18 mln
-1.15 mln
-21.58%
jan 1, 2003
6.07 mln
+1.89 mln
45.22%
jan 1, 2004
6.63 mln
+560.0K
9.23%
jan 1, 2005
6.45 mln
-180.0K
-2.71%
Ranking of countries by current statistics by years
