29
/
en
AIzaSyAYiBZKx7MnpbEhh9jyipgxe19OcubqV5w
April 1, 2024
241937
Slovak Republic
SVK
true
2
1
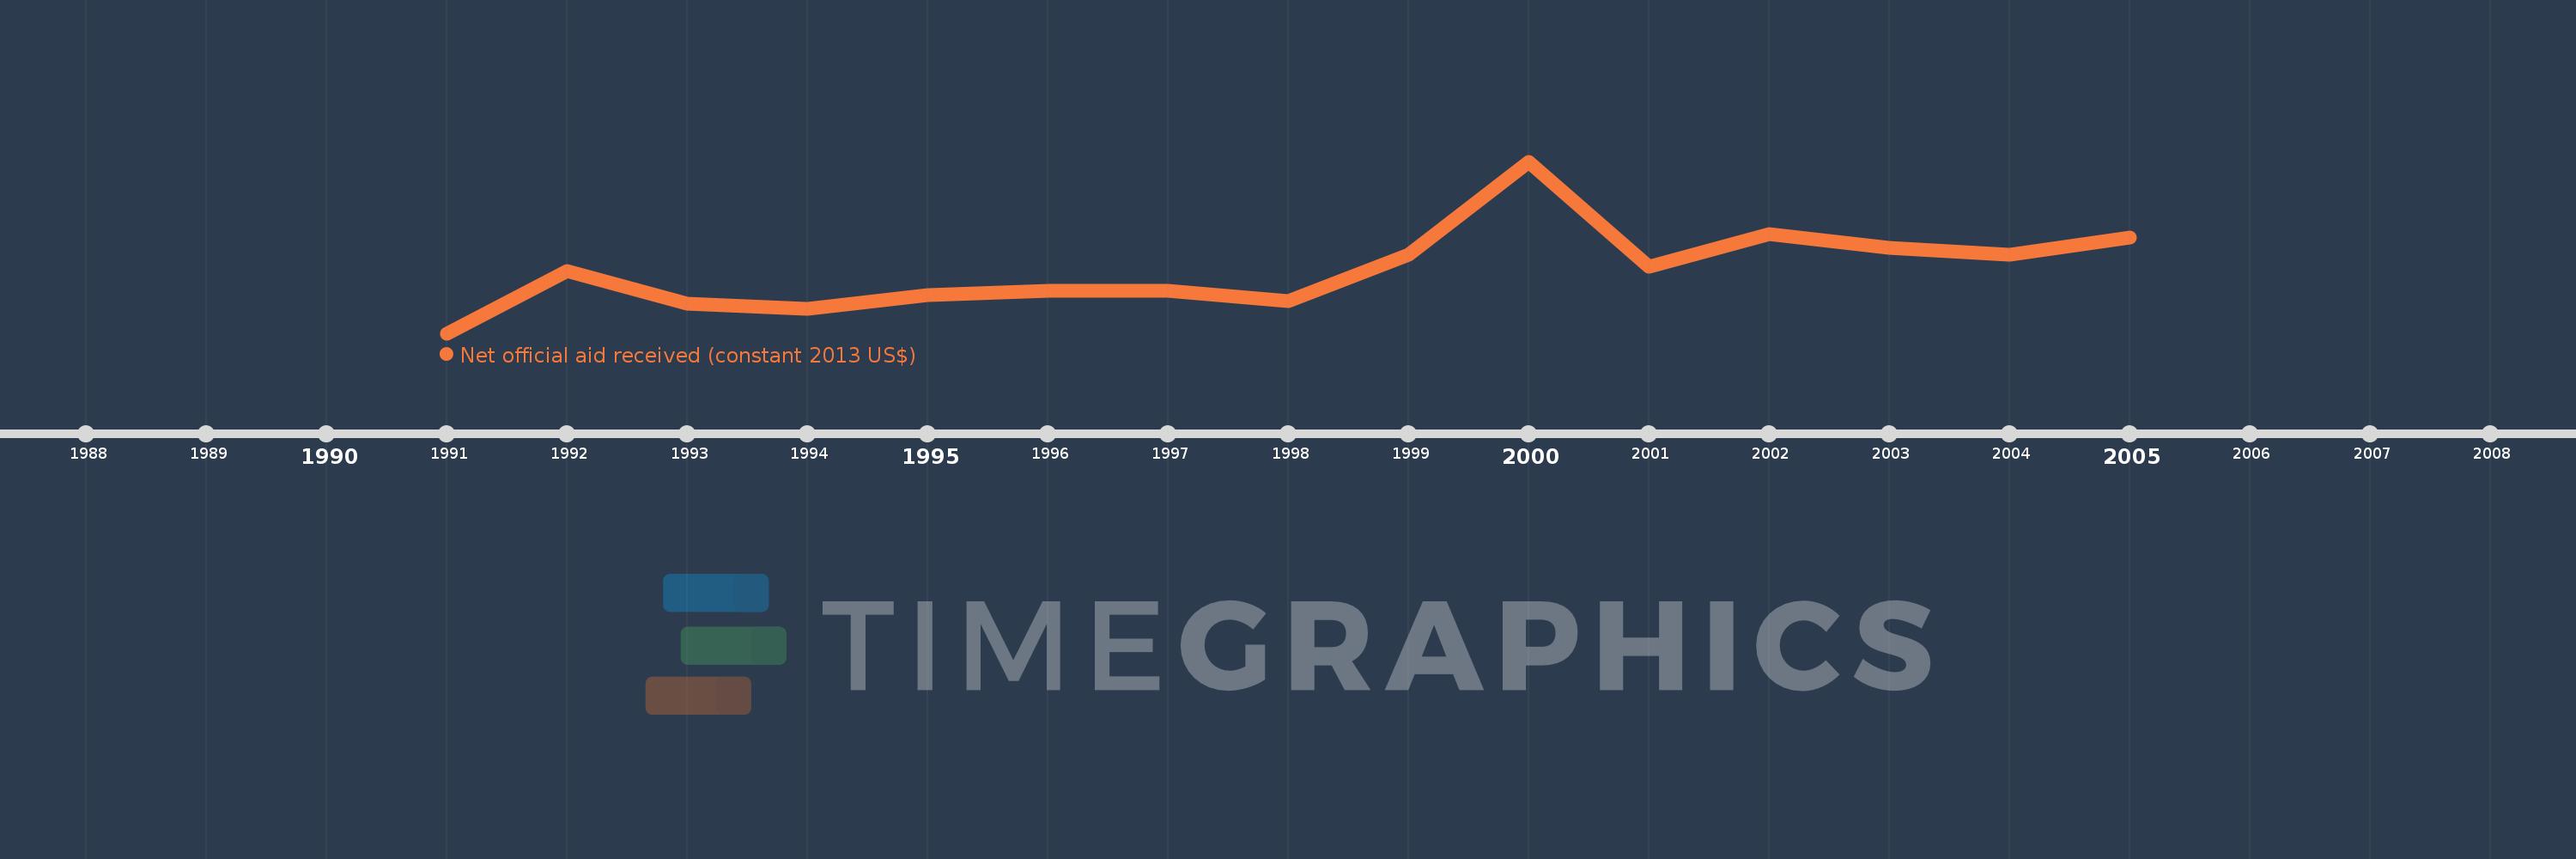
Net official aid received (constant 2013 US$)
2005,2004,2003,2002,2001,2000,1999,1998,1997,1996,1995,1994,1993,1992,1991
This statistics in other country:
Timeline:
This timeline shows a graph from 1991 to 2005 of Slovak Republic. No data until 1990. Number of actual observations by date: 15.
Source name:
World Development Indicators
Source organization:
Development Assistance Committee of the Organisation for Economic Co-operation and Development, Geographical Distribution of Financial Flows to Developing Countries, Development Co-operation Report, and International Development Statistics database. Data are available online at: www.oecd.org/dac/stats/idsonline.
Categories, topics:
Aid Effectiveness
Last updated:
apr 23, 2017
Indicators value changes by year
Minimum:
11.5 mln
jan 1, 1991
Maximum:
498.27 mln
jan 1, 2000
At the date of observation
Value
Absolute change
Change from previous value
jan 1, 1991
11.5 mln
+11.5 mln
0.0%
jan 1, 1992
188.17 mln
+176.67 mln
1.54K%
jan 1, 1993
95.22 mln
-92.95 mln
-49.4%
jan 1, 1994
80.24 mln
-14.98 mln
-15.73%
jan 1, 1995
120.23 mln
+39.99 mln
49.84%
jan 1, 1996
132.85 mln
+12.62 mln
10.5%
jan 1, 1997
133.05 mln
+200.0K
0.15%
jan 1, 1998
103.88 mln
-29.17 mln
-21.92%
jan 1, 1999
233.37 mln
+129.49 mln
124.65%
jan 1, 2000
498.27 mln
+264.9 mln
113.51%
jan 1, 2001
198.98 mln
-299.29 mln
-60.07%
jan 1, 2002
292.02 mln
+93.04 mln
46.76%
jan 1, 2003
253.24 mln
-38.78 mln
-13.28%
jan 1, 2004
233.66 mln
-19.58 mln
-7.73%
jan 1, 2005
282.52 mln
+48.86 mln
20.91%
Ranking of countries by current statistics by years


Comments: