29
/
en
AIzaSyAYiBZKx7MnpbEhh9jyipgxe19OcubqV5w
April 1, 2024
49318
Middle East & North Africa (excluding high income)
MNA
false
2
1
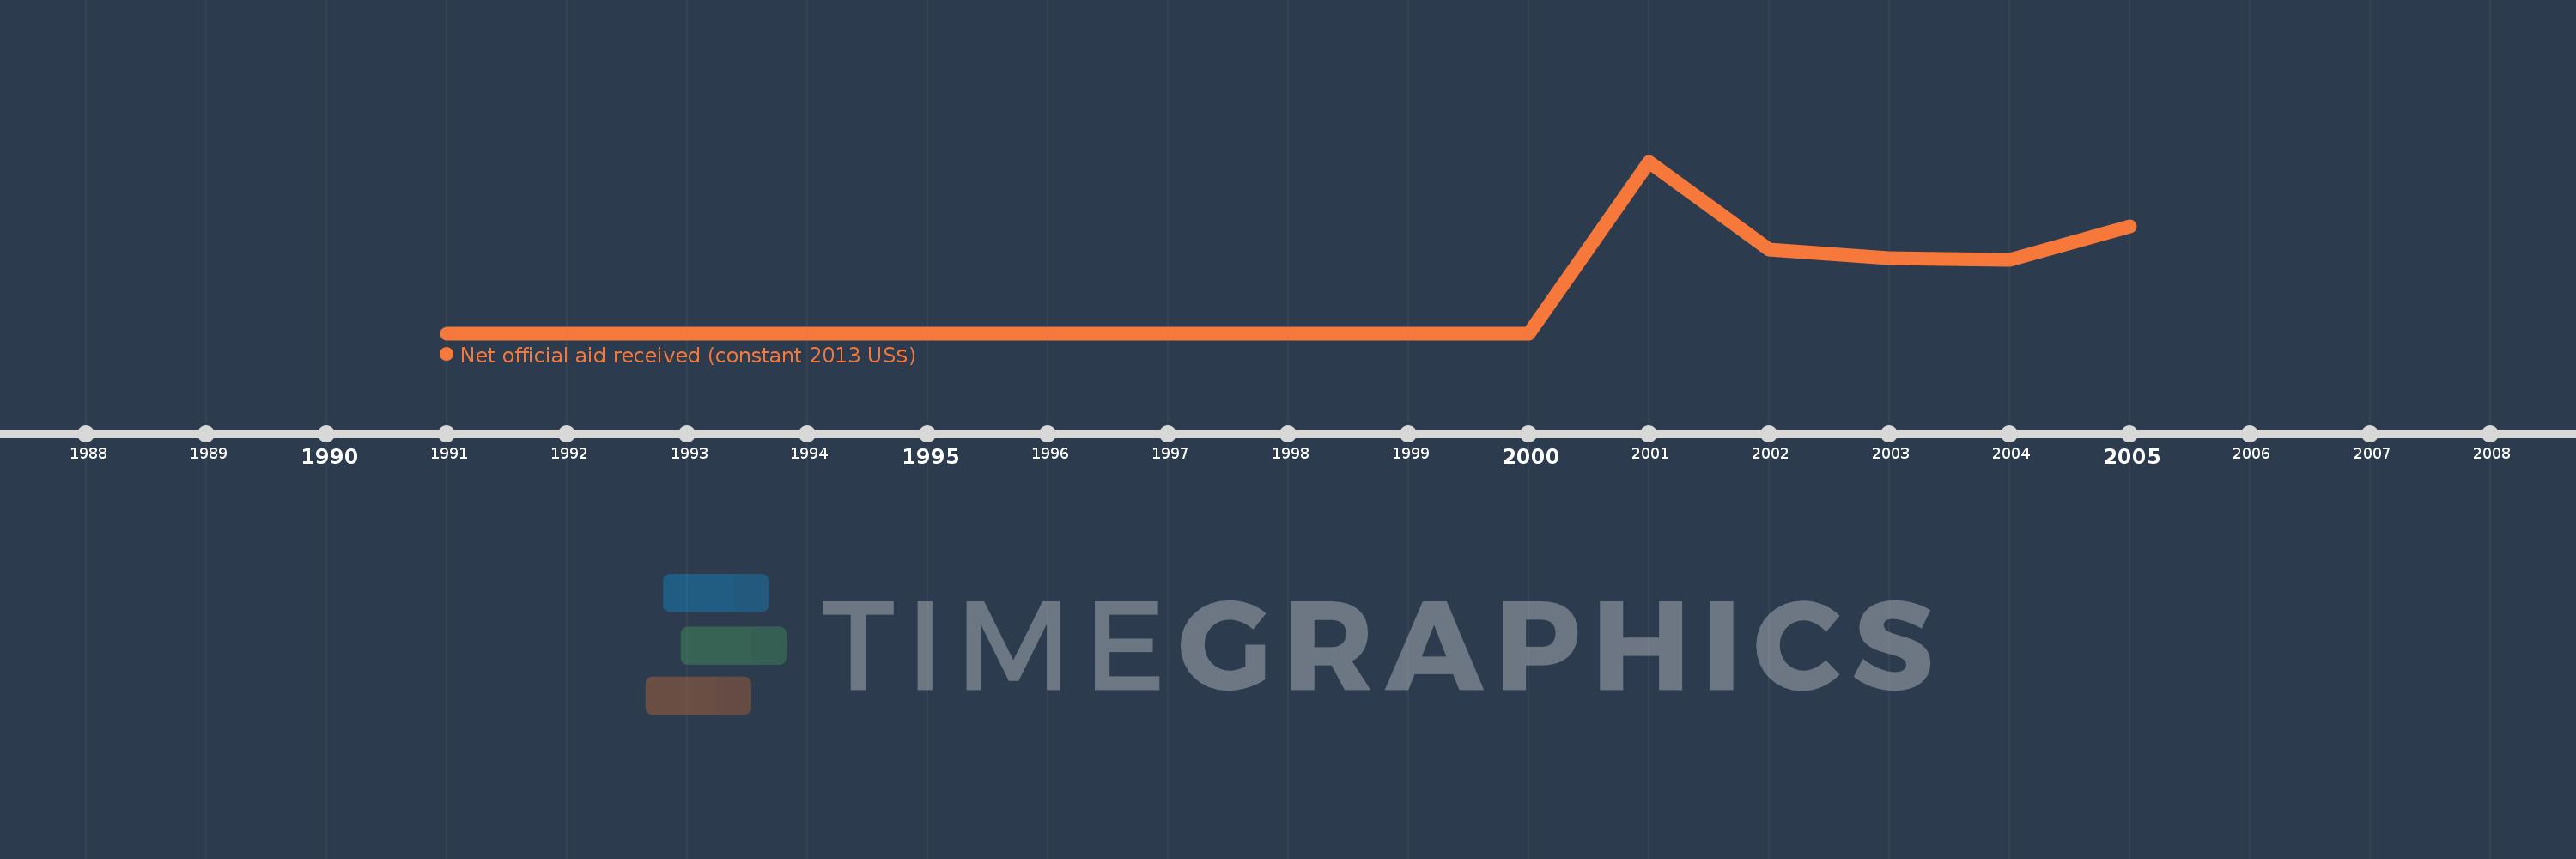
Net official aid received (constant 2013 US$)
2005,2004,2003,2002,2001,2000,1999,1998,1997,1996,1995,1994,1993,1992,1991
This statistics in other country:
Timeline:
This timeline shows a graph from 1991 to 2005 of Middle East & North Africa (excluding high income). No data until 1990. Number of actual observations by date: 15.
Source name:
World Development Indicators
Source organization:
Development Assistance Committee of the Organisation for Economic Co-operation and Development, Geographical Distribution of Financial Flows to Developing Countries, Development Co-operation Report, and International Development Statistics database. Data are available online at: www.oecd.org/dac/stats/idsonline.
Categories, topics:
Aid Effectiveness
Last updated:
apr 23, 2017
Indicators value changes by year
Maximum:
24.82 mln
jan 1, 2001
At the date of observation
Value
Absolute change
Change from previous value
jan 1, 2001
24.82 mln
+24.82 mln
%
jan 1, 2002
12.05 mln
-12.77 mln
-51.45%
jan 1, 2003
10.83 mln
-1.22 mln
-10.12%
jan 1, 2004
10.62 mln
-210.0K
-1.94%
jan 1, 2005
15.44 mln
+4.82 mln
45.39%
Ranking of countries by current statistics by years


Comments: