29
/
en
AIzaSyAYiBZKx7MnpbEhh9jyipgxe19OcubqV5w
April 1, 2024
273354
Ukraine
UKR
true
2
1
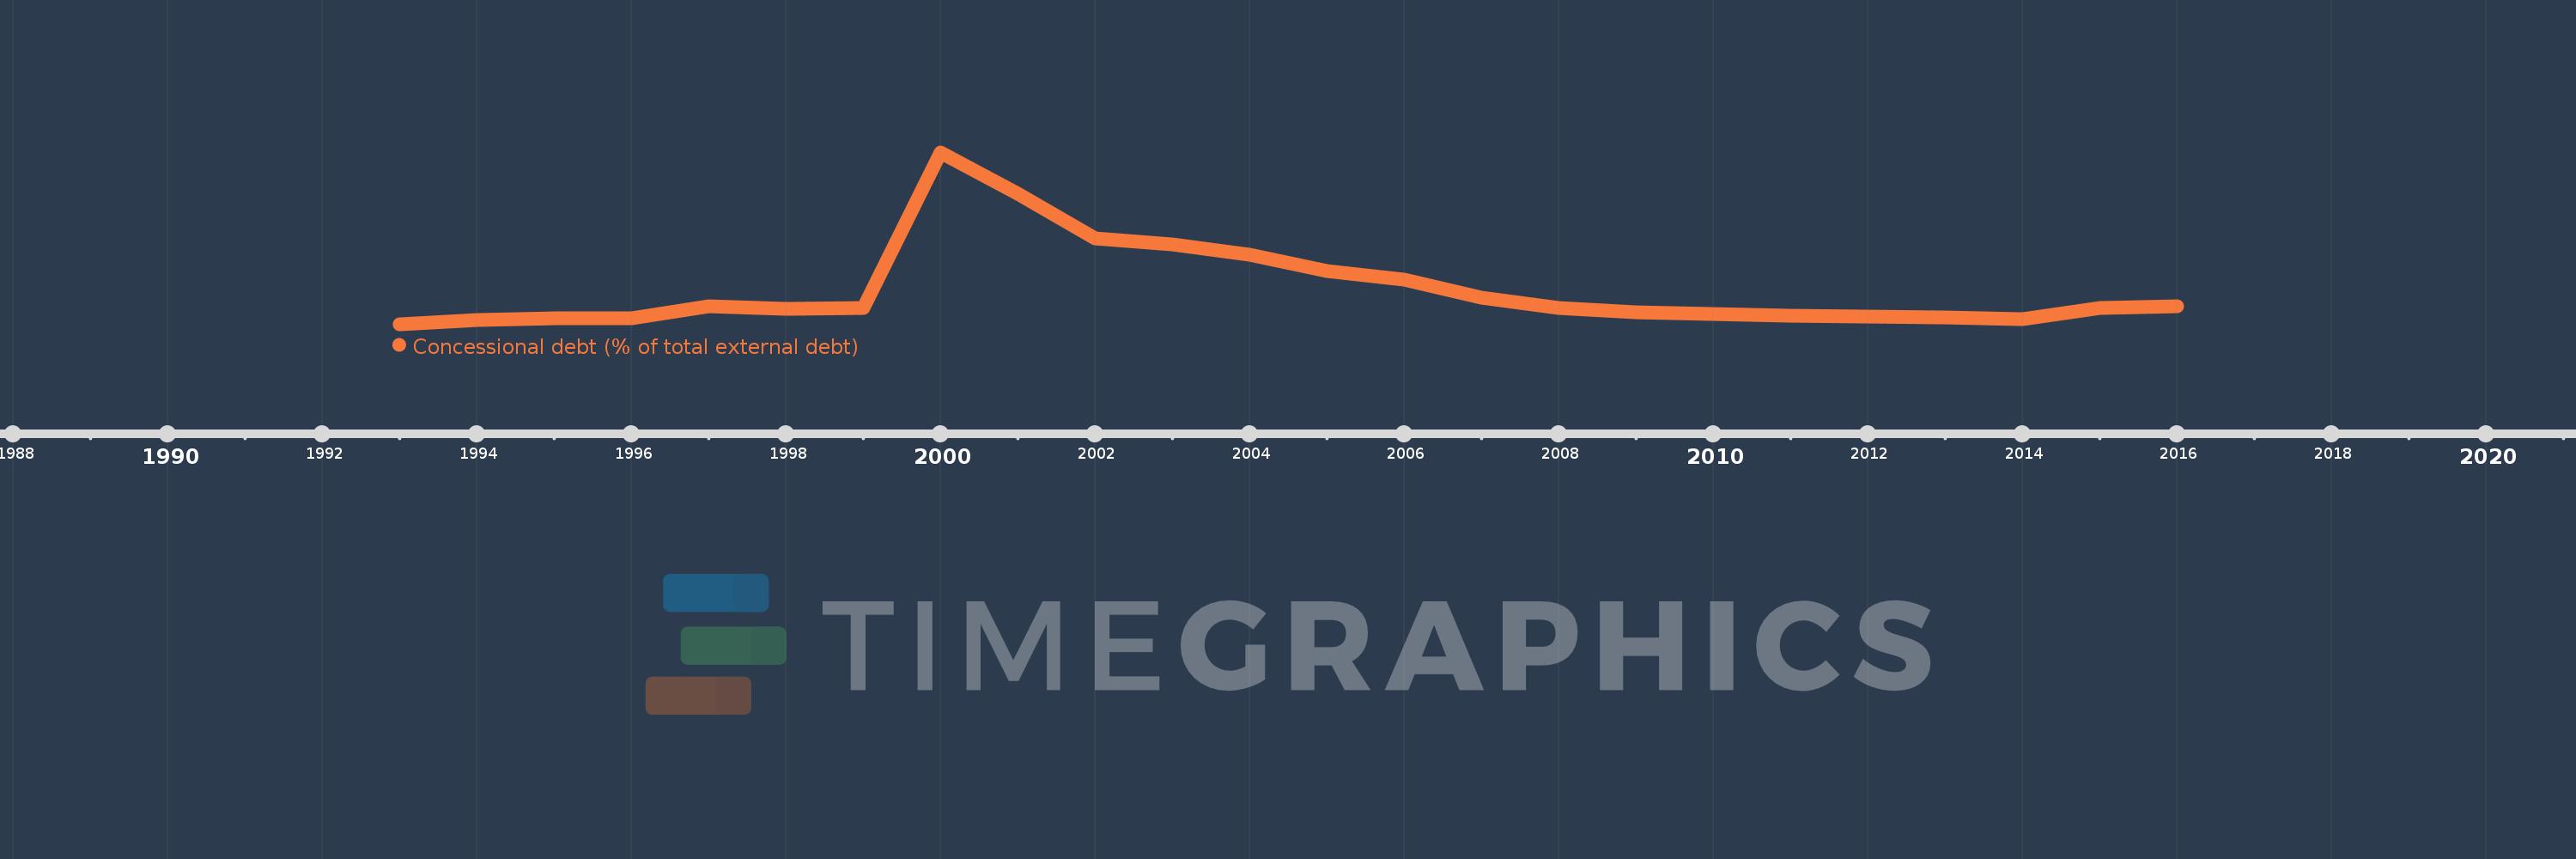
Concessional debt (% of total external debt)
2016,2015,2014,2013,2012,2011,2010,2009,2008,2007,2006,2005,2004,2003,2002,2001,2000,1999,1998,1997,1996,1995,1994,1993
This statistics in other country:
Timeline:
This timeline shows a graph from 1993 to 2016 of Ukraine. No data until 1992. Number of actual observations by date: 24.
Source name:
World Development Indicators
Source organization:
World Bank, International Debt Statistics.
Categories, topics:
External Debt
Last updated:
apr 23, 2017
Indicators value changes by year
Maximum:
21.344
jan 1, 2000
At the date of observation
Value
Absolute change
Change from previous value
jan 1, 1994
0.508
+0.508
%
jan 1, 1995
0.701
+0.193
37.89%
jan 1, 1996
0.762
+0.062
8.84%
jan 1, 1997
2.277
+1.515
198.62%
jan 1, 1998
1.903
-0.374
-16.43%
jan 1, 1999
2.015
+0.112
5.9%
jan 1, 2000
21.344
+19.328
959.14%
jan 1, 2001
16.227
-5.116
-23.97%
jan 1, 2002
10.635
-5.592
-34.46%
jan 1, 2003
9.912
-0.722
-6.79%
jan 1, 2004
8.656
-1.257
-12.68%
jan 1, 2005
6.61
-2.046
-23.63%
jan 1, 2006
5.491
-1.119
-16.92%
jan 1, 2007
3.266
-2.226
-40.53%
jan 1, 2008
2.007
-1.259
-38.55%
jan 1, 2009
1.474
-0.532
-26.52%
jan 1, 2010
1.302
-0.173
-11.71%
jan 1, 2011
1.026
-0.276
-21.19%
jan 1, 2012
0.922
-0.104
-10.15%
jan 1, 2013
0.82
-0.102
-11.05%
jan 1, 2014
0.607
-0.213
-26.0%
jan 1, 2015
2.042
+1.435
236.52%
jan 1, 2016
2.272
+0.231
11.29%
Ranking of countries by current statistics by years


Comments: