29
/
en
AIzaSyAYiBZKx7MnpbEhh9jyipgxe19OcubqV5w
April 1, 2024
64465
Albania
ALB
true
2
1
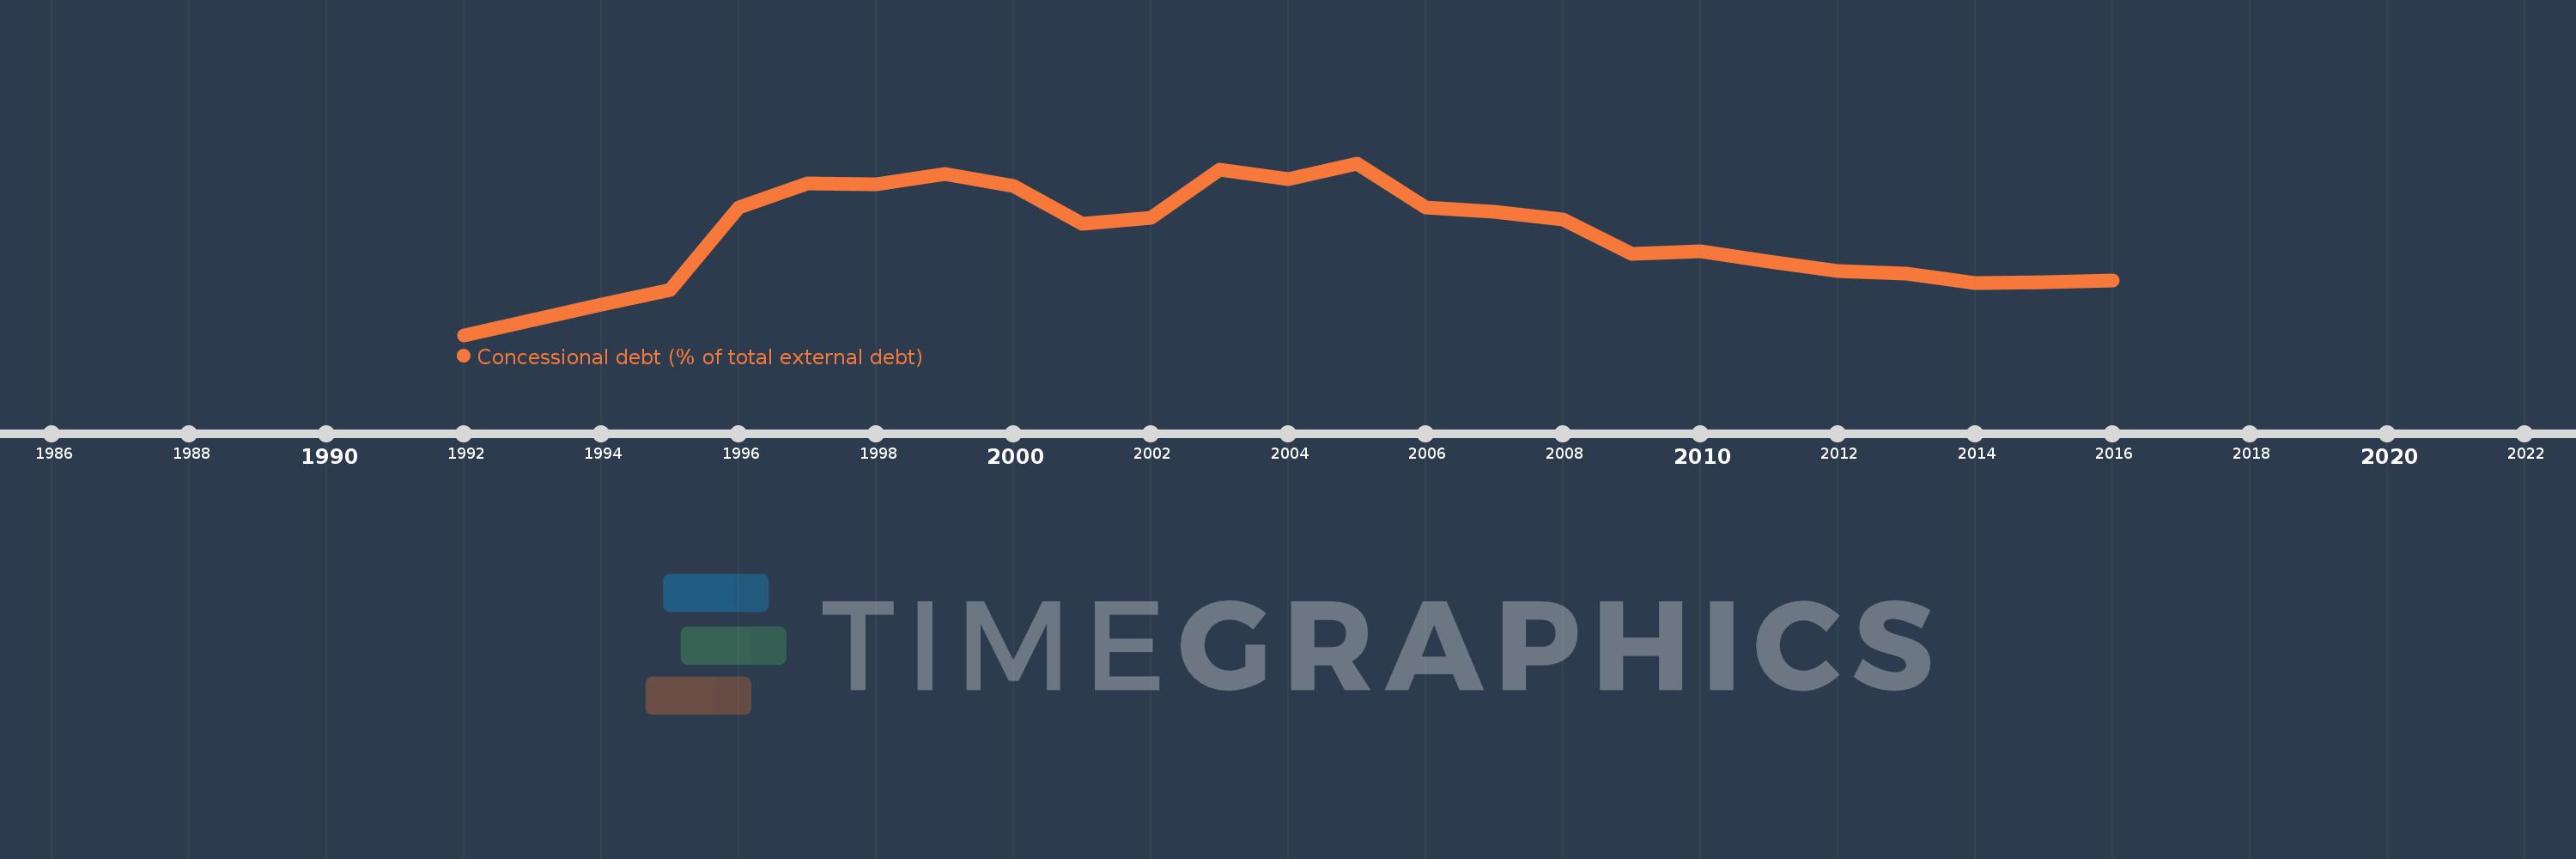
Concessional debt (% of total external debt)
2016,2015,2014,2013,2012,2011,2010,2009,2008,2007,2006,2005,2004,2003,2002,2001,2000,1999,1998,1997,1996,1995,1994,1993,1992
This statistics in other country:
Timeline:
This timeline shows a graph from 1992 to 2016 of Albania. No data until 1991. Number of actual observations by date: 25.
Source name:
World Development Indicators
Source organization:
World Bank, International Debt Statistics.
Categories, topics:
External Debt
Last updated:
apr 23, 2017
Indicators value changes by year
Maximum:
74.945
jan 1, 2005
At the date of observation
Value
Absolute change
Change from previous value
jan 1, 1992
1.603
+1.603
0.0%
jan 1, 1993
7.853
+6.249
389.73%
jan 1, 1994
14.534
+6.681
85.08%
jan 1, 1995
20.946
+6.412
44.12%
jan 1, 1996
56.19
+35.244
168.26%
jan 1, 1997
66.33
+10.139
18.04%
jan 1, 1998
66.138
-0.192
-0.29%
jan 1, 1999
70.368
+4.23
6.4%
jan 1, 2000
65.329
-5.039
-7.16%
jan 1, 2001
48.926
-16.402
-25.11%
jan 1, 2002
51.594
+2.668
5.45%
jan 1, 2003
72.216
+20.621
39.97%
jan 1, 2004
68.082
-4.134
-5.72%
jan 1, 2005
74.945
+6.863
10.08%
jan 1, 2006
56.159
-18.786
-25.07%
jan 1, 2007
54.199
-1.96
-3.49%
jan 1, 2008
51.057
-3.142
-5.8%
jan 1, 2009
36.383
-14.674
-28.74%
jan 1, 2010
37.391
+1.008
2.77%
jan 1, 2011
32.779
-4.612
-12.33%
jan 1, 2012
28.913
-3.866
-11.79%
jan 1, 2013
27.695
-1.218
-4.21%
jan 1, 2014
23.88
-3.815
-13.77%
jan 1, 2015
24.015
+0.134
0.56%
jan 1, 2016
24.873
+0.859
3.58%
Ranking of countries by current statistics by years


Comments: