29
/
en
AIzaSyAYiBZKx7MnpbEhh9jyipgxe19OcubqV5w
April 1, 2024
188818
Maldives
MDV
true
2
1
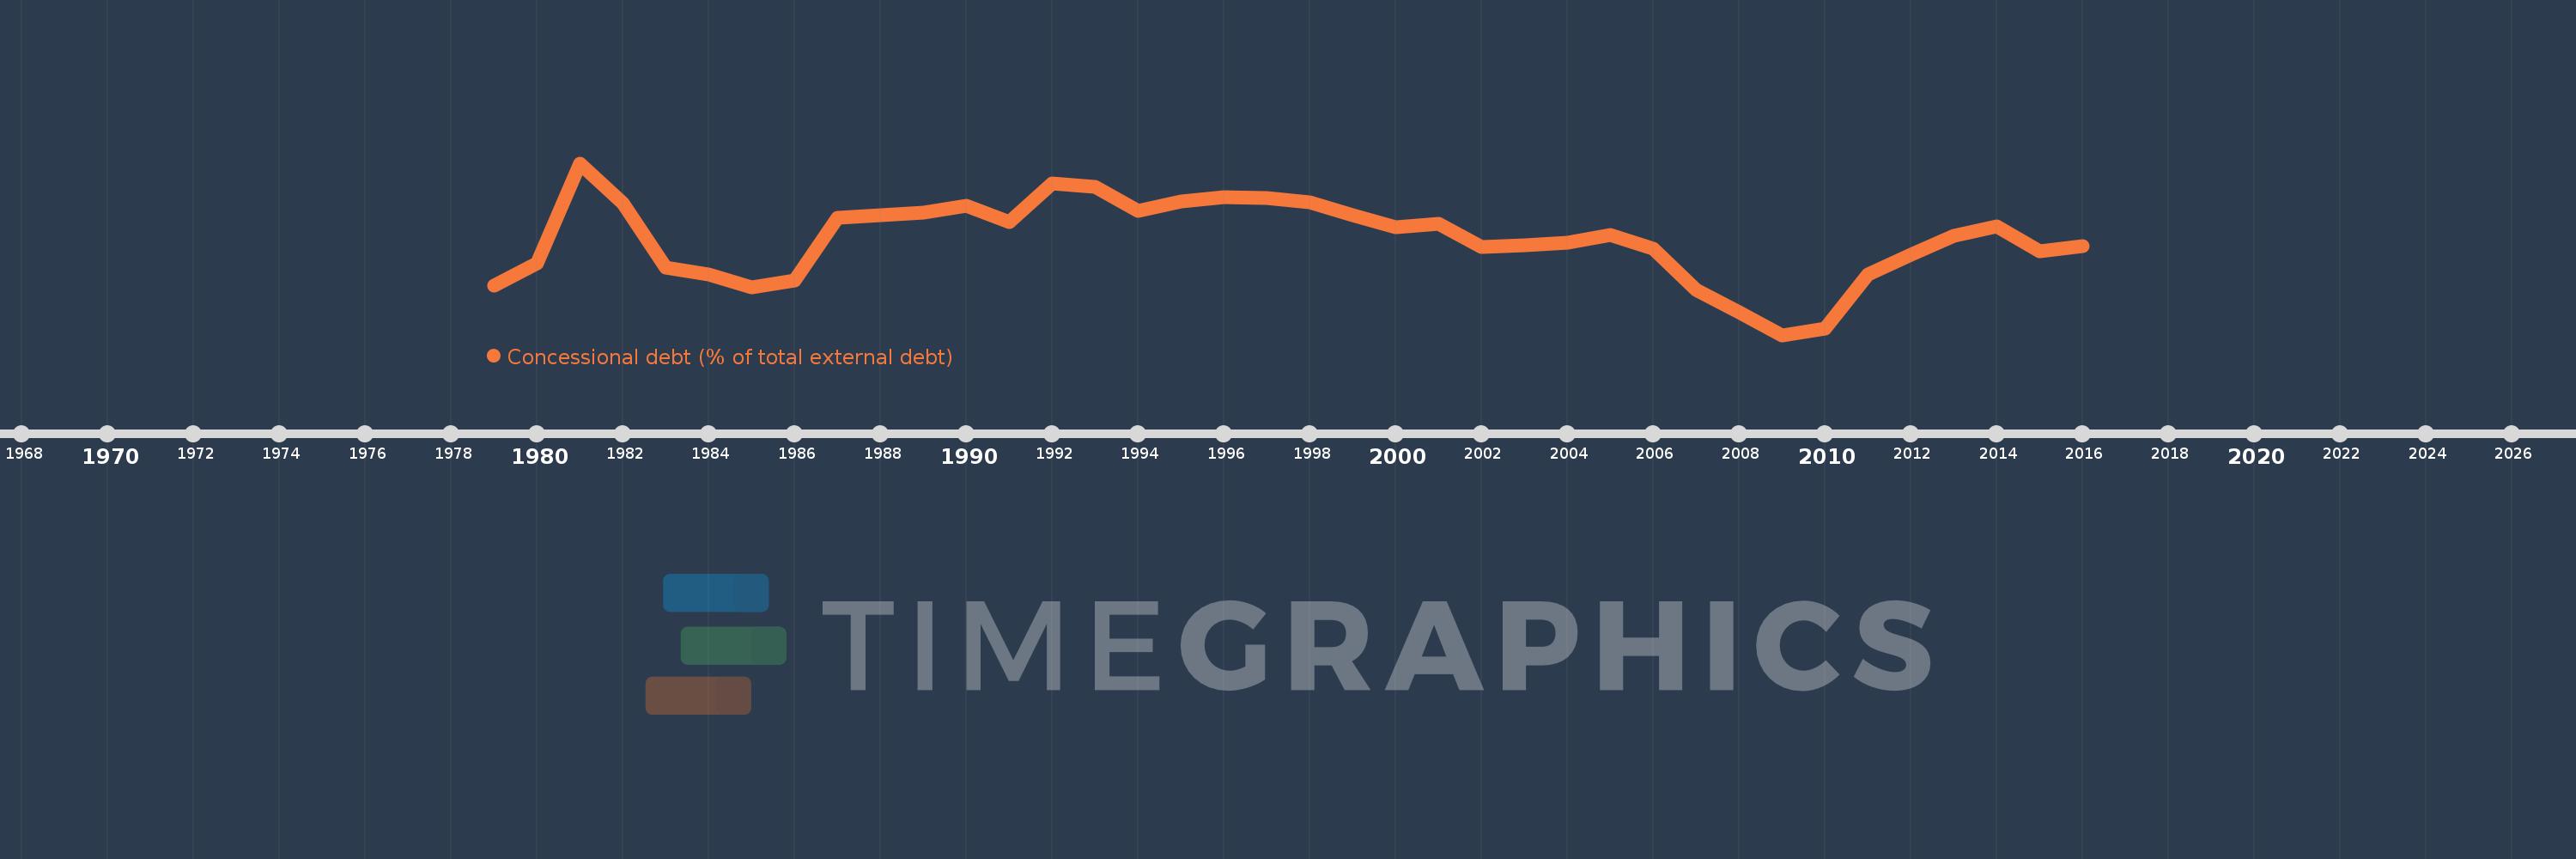
Concessional debt (% of total external debt)
2016,2015,2014,2013,2012,2011,2010,2009,2008,2007,2006,2005,2004,2003,2002,2001,2000,1999,1998,1997,1996,1995,1994,1993,1992,1991,1990,1989,1988,1987,1986,1985,1984,1983,1982,1981,1980,1979
This statistics in other country:
Timeline:
This timeline shows a graph from 1979 to 2016 of Maldives. No data until 1978. Number of actual observations by date: 38.
Source name:
World Development Indicators
Source organization:
World Bank, International Debt Statistics.
Categories, topics:
External Debt
Last updated:
apr 23, 2017
Indicators value changes by year
Minimum:
22.297
jan 1, 2009
Maximum:
96.118
jan 1, 1981
At the date of observation
Value
Absolute change
Change from previous value
jan 1, 1979
43.602
+43.602
0.0%
jan 1, 1980
53.059
+9.458
21.69%
jan 1, 1981
96.118
+43.059
81.15%
jan 1, 1982
78.838
-17.28
-17.98%
jan 1, 1983
51.321
-27.517
-34.9%
jan 1, 1984
48.432
-2.889
-5.63%
jan 1, 1985
42.64
-5.792
-11.96%
jan 1, 1986
45.671
+3.031
7.11%
jan 1, 1987
72.791
+27.12
59.38%
jan 1, 1988
73.94
+1.15
1.58%
jan 1, 1989
74.957
+1.017
1.37%
jan 1, 1990
77.952
+2.995
4.0%
jan 1, 1991
71.002
-6.95
-8.92%
jan 1, 1992
87.497
+16.495
23.23%
jan 1, 1993
86.149
-1.347
-1.54%
jan 1, 1994
75.538
-10.612
-12.32%
jan 1, 1995
79.611
+4.073
5.39%
jan 1, 1996
81.62
+2.009
2.52%
jan 1, 1997
81.026
-0.593
-0.73%
jan 1, 1998
79.143
-1.883
-2.32%
jan 1, 1999
73.798
-5.345
-6.75%
jan 1, 2000
68.603
-5.195
-7.04%
jan 1, 2001
70.104
+1.501
2.19%
jan 1, 2002
59.966
-10.138
-14.46%
jan 1, 2003
60.754
+0.788
1.31%
jan 1, 2004
61.947
+1.193
1.96%
jan 1, 2005
65.41
+3.463
5.59%
jan 1, 2006
59.431
-5.979
-9.14%
jan 1, 2007
41.721
-17.71
-29.8%
jan 1, 2008
32.092
-9.629
-23.08%
jan 1, 2009
22.297
-9.795
-30.52%
jan 1, 2010
25.16
+2.863
12.84%
jan 1, 2011
48.181
+23.021
91.5%
jan 1, 2012
56.66
+8.479
17.6%
jan 1, 2013
64.991
+8.331
14.7%
jan 1, 2014
69.156
+4.165
6.41%
jan 1, 2015
58.109
-11.047
-15.97%
jan 1, 2016
60.473
+2.364
4.07%
Ranking of countries by current statistics by years


Comments: