29
/
en
AIzaSyAYiBZKx7MnpbEhh9jyipgxe19OcubqV5w
April 1, 2024
272167
Uganda
UGA
true
2
1
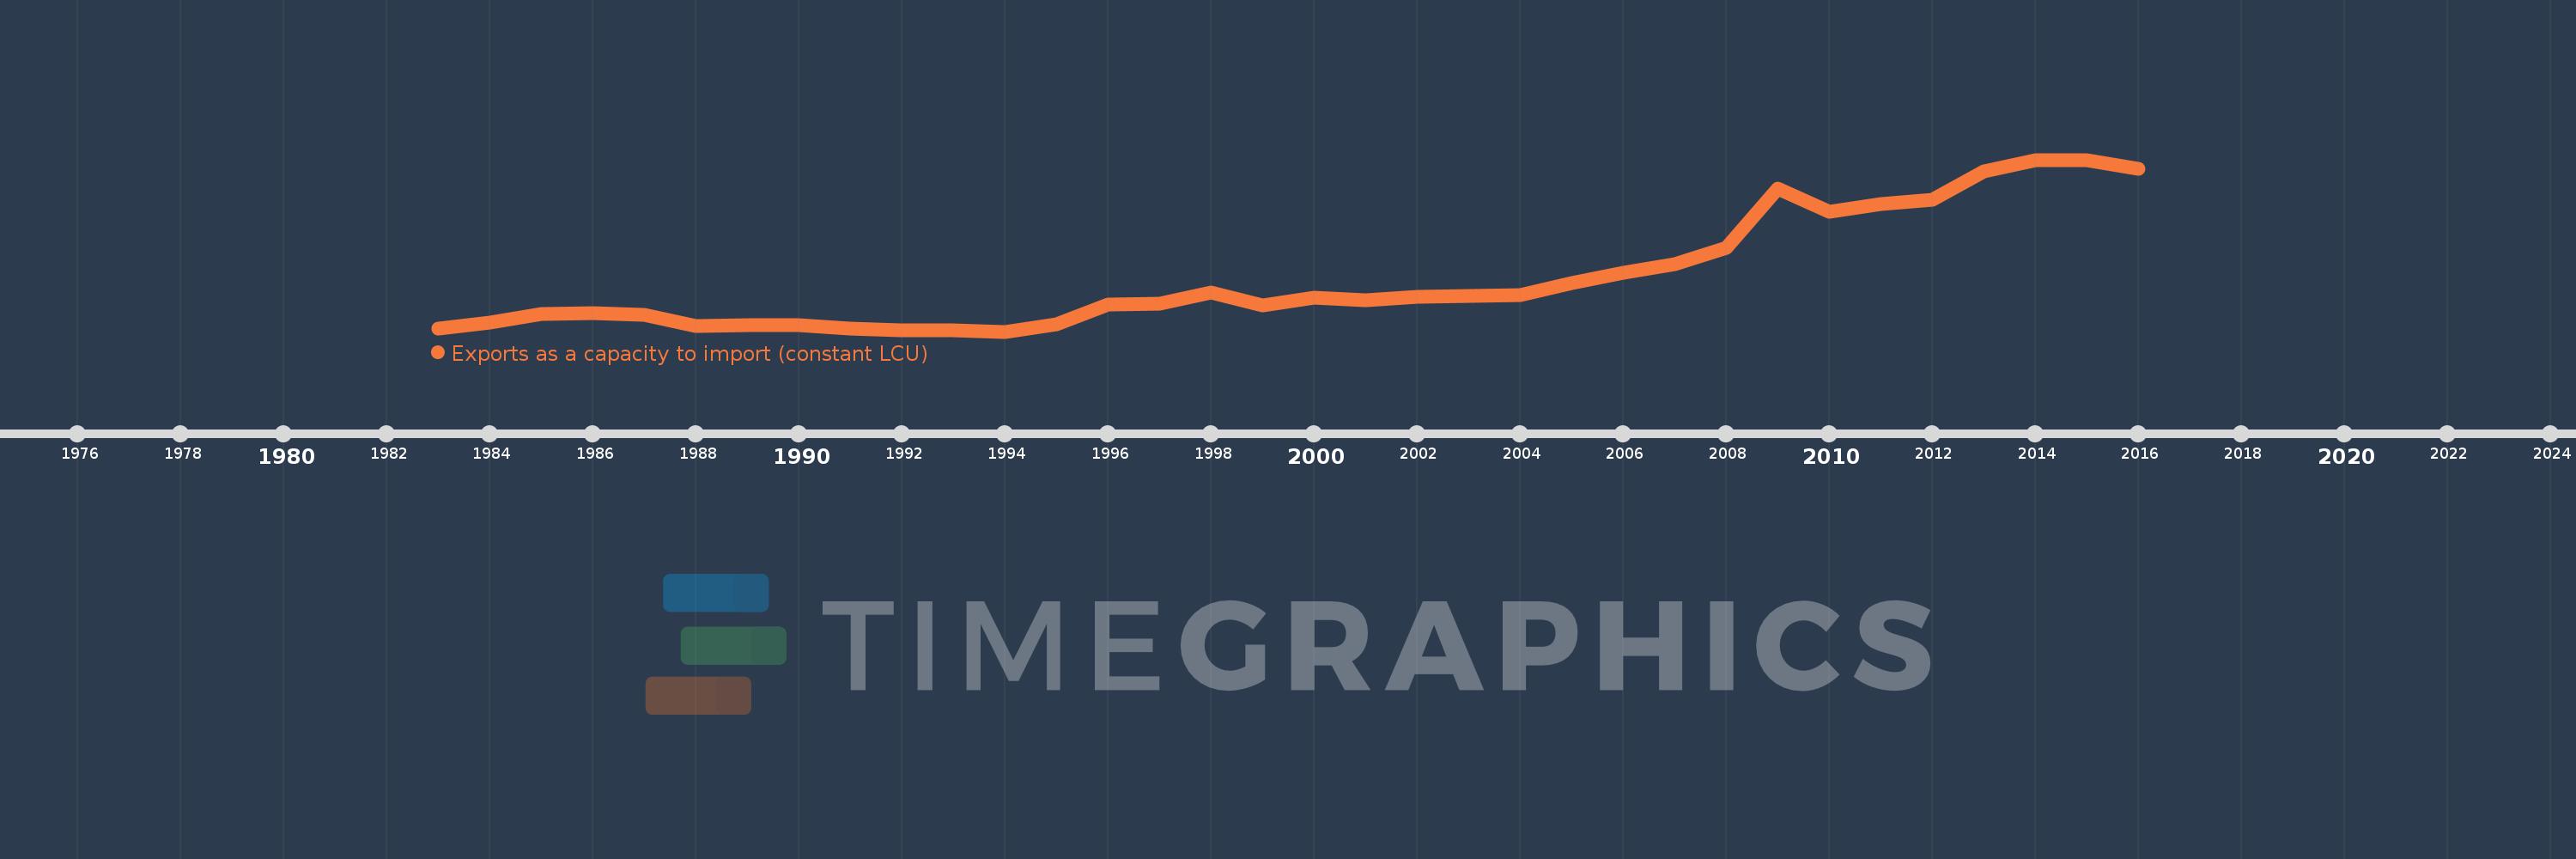
Exports as a capacity to import (constant LCU)
2016,2015,2014,2013,2012,2011,2010,2009,2008,2007,2006,2005,2004,2003,2002,2001,2000,1999,1998,1997,1996,1995,1994,1993,1992,1991,1990,1989,1988,1987,1986,1985,1984,1983
This statistics in other country:
AlbaniaAlgeriaAngolaAntigua and BarbudaArgentinaArmeniaAustraliaAustriaAzerbaijanBahamas, TheBahrainBangladeshBarbadosBelarusBelgiumBelizeBeninBhutanBoliviaBosnia and HerzegovinaBotswanaBrazilBrunei DarussalamBulgariaBurkina FasoBurundiCabo VerdeCambodiaCameroonCanadaChadChileColombiaComorosCongo, Dem. Rep.Congo, Rep.Costa RicaCote d'IvoireCroatiaCubaCyprusCzech RepublicDenmarkDjiboutiDominican RepublicEcuadorEgypt, Arab Rep.El SalvadorEquatorial GuineaEritreaEstoniaEthiopiaFijiFinlandFranceGabonGambia, TheGeorgiaGermanyGhanaGreeceGuatemalaGuineaGuinea-BissauHaitiHondurasHong Kong SAR, ChinaHungaryIcelandIndiaIndonesiaIran, Islamic Rep.IrelandIsraelItalyJamaicaJapanJordanKazakhstanKenyaKorea, Rep.KosovoKuwaitKyrgyz RepublicLao PDRLatviaLebanonLiberiaLibyaLithuaniaLuxembourgMacao SAR, ChinaMacedonia, FYRMadagascarMalawiMalaysiaMaliMaltaMauritaniaMauritiusMexicoMoldovaMongoliaMontenegroMoroccoMozambiqueMyanmarNamibiaNepalNetherlandsNew ZealandNicaraguaNigerNigeriaNorwayOmanPakistanPanamaPapua New GuineaParaguayPeruPhilippinesPolandPortugalPuerto RicoQatarRomaniaRussian FederationRwandaSamoaSaudi ArabiaSenegalSerbiaSeychellesSierra LeoneSingaporeSlovak RepublicSloveniaSomaliaSouth AfricaSouth SudanSpainSri LankaSudanSurinameSwazilandSwedenSwitzerlandSyrian Arab RepublicTajikistanTanzaniaThailandTimor-LesteTogoTrinidad and TobagoTunisiaTurkeyTurkmenistanUgandaUkraineUnited Arab EmiratesUnited KingdomUnited StatesUruguayUzbekistanVanuatuVenezuela, RBVietnamWest Bank and GazaZambiaZimbabwe Timeline:
This timeline shows a graph from 1983 to 2016 of Uganda. No data until 1982. Number of actual observations by date: 34.
Source name:
World Development Indicators
Source organization:
World Bank national accounts data, and OECD National Accounts data files.
Categories, topics:
Economy & Growth, Trade
Last updated:
apr 23, 2017
Indicators value changes by year
Minimum:
681.61 bln
jan 1, 1994
Maximum:
9.201 trl
jan 1, 2014
At the date of observation
Value
Absolute change
Change from previous value
jan 1, 1983
825.309 bln
+825.309 bln
0.0%
jan 1, 1984
1.145 trl
+319.695 bln
38.74%
jan 1, 1985
1.535 trl
+390.043 bln
34.06%
jan 1, 1986
1.584 trl
+49.289 bln
3.21%
jan 1, 1987
1.502 trl
-81.948 bln
-5.17%
jan 1, 1988
962.341 bln
-540.047 bln
-35.95%
jan 1, 1989
996.724 bln
+34.383 bln
3.57%
jan 1, 1990
1.005 trl
+8.518 bln
0.85%
jan 1, 1991
843.178 bln
-162.063 bln
-16.12%
jan 1, 1992
731.362 bln
-111.816 bln
-13.26%
jan 1, 1993
763.073 bln
+31.711 bln
4.34%
jan 1, 1994
681.61 bln
-81.463 bln
-10.68%
jan 1, 1995
1.043 trl
+361.764 bln
53.07%
jan 1, 1996
2.006 trl
+962.207 bln
92.22%
jan 1, 1997
2.045 trl
+39.612 bln
1.98%
jan 1, 1998
2.623 trl
+577.798 bln
28.25%
jan 1, 1999
1.989 trl
-634.229 bln
-24.18%
jan 1, 2000
2.362 trl
+373.302 bln
18.77%
jan 1, 2001
2.25 trl
-112.056 bln
-4.74%
jan 1, 2002
2.418 trl
+167.545 bln
7.45%
jan 1, 2003
2.446 trl
+28.888 bln
1.19%
jan 1, 2004
2.484 trl
+37.081 bln
1.52%
jan 1, 2005
3.106 trl
+622.268 bln
25.06%
jan 1, 2006
3.582 trl
+476.198 bln
15.33%
jan 1, 2007
4.036 trl
+453.642 bln
12.66%
jan 1, 2008
4.851 trl
+815.853 bln
20.22%
jan 1, 2009
7.768 trl
+2.917 trl
60.13%
jan 1, 2010
6.614 trl
-1.155 trl
-14.86%
jan 1, 2011
7.016 trl
+402.572 bln
6.09%
jan 1, 2012
7.229 trl
+212.524 bln
3.03%
jan 1, 2013
8.644 trl
+1.415 trl
19.57%
jan 1, 2014
9.201 trl
+557.69 bln
6.45%
jan 1, 2015
9.17 trl
-31.499 bln
-0.34%
jan 1, 2016
8.754 trl
-415.564 bln
-4.53%
Ranking of countries by current statistics by years


Comments: