29
/
en
AIzaSyAYiBZKx7MnpbEhh9jyipgxe19OcubqV5w
April 1, 2024
220757
Paraguay
PRY
true
2
1
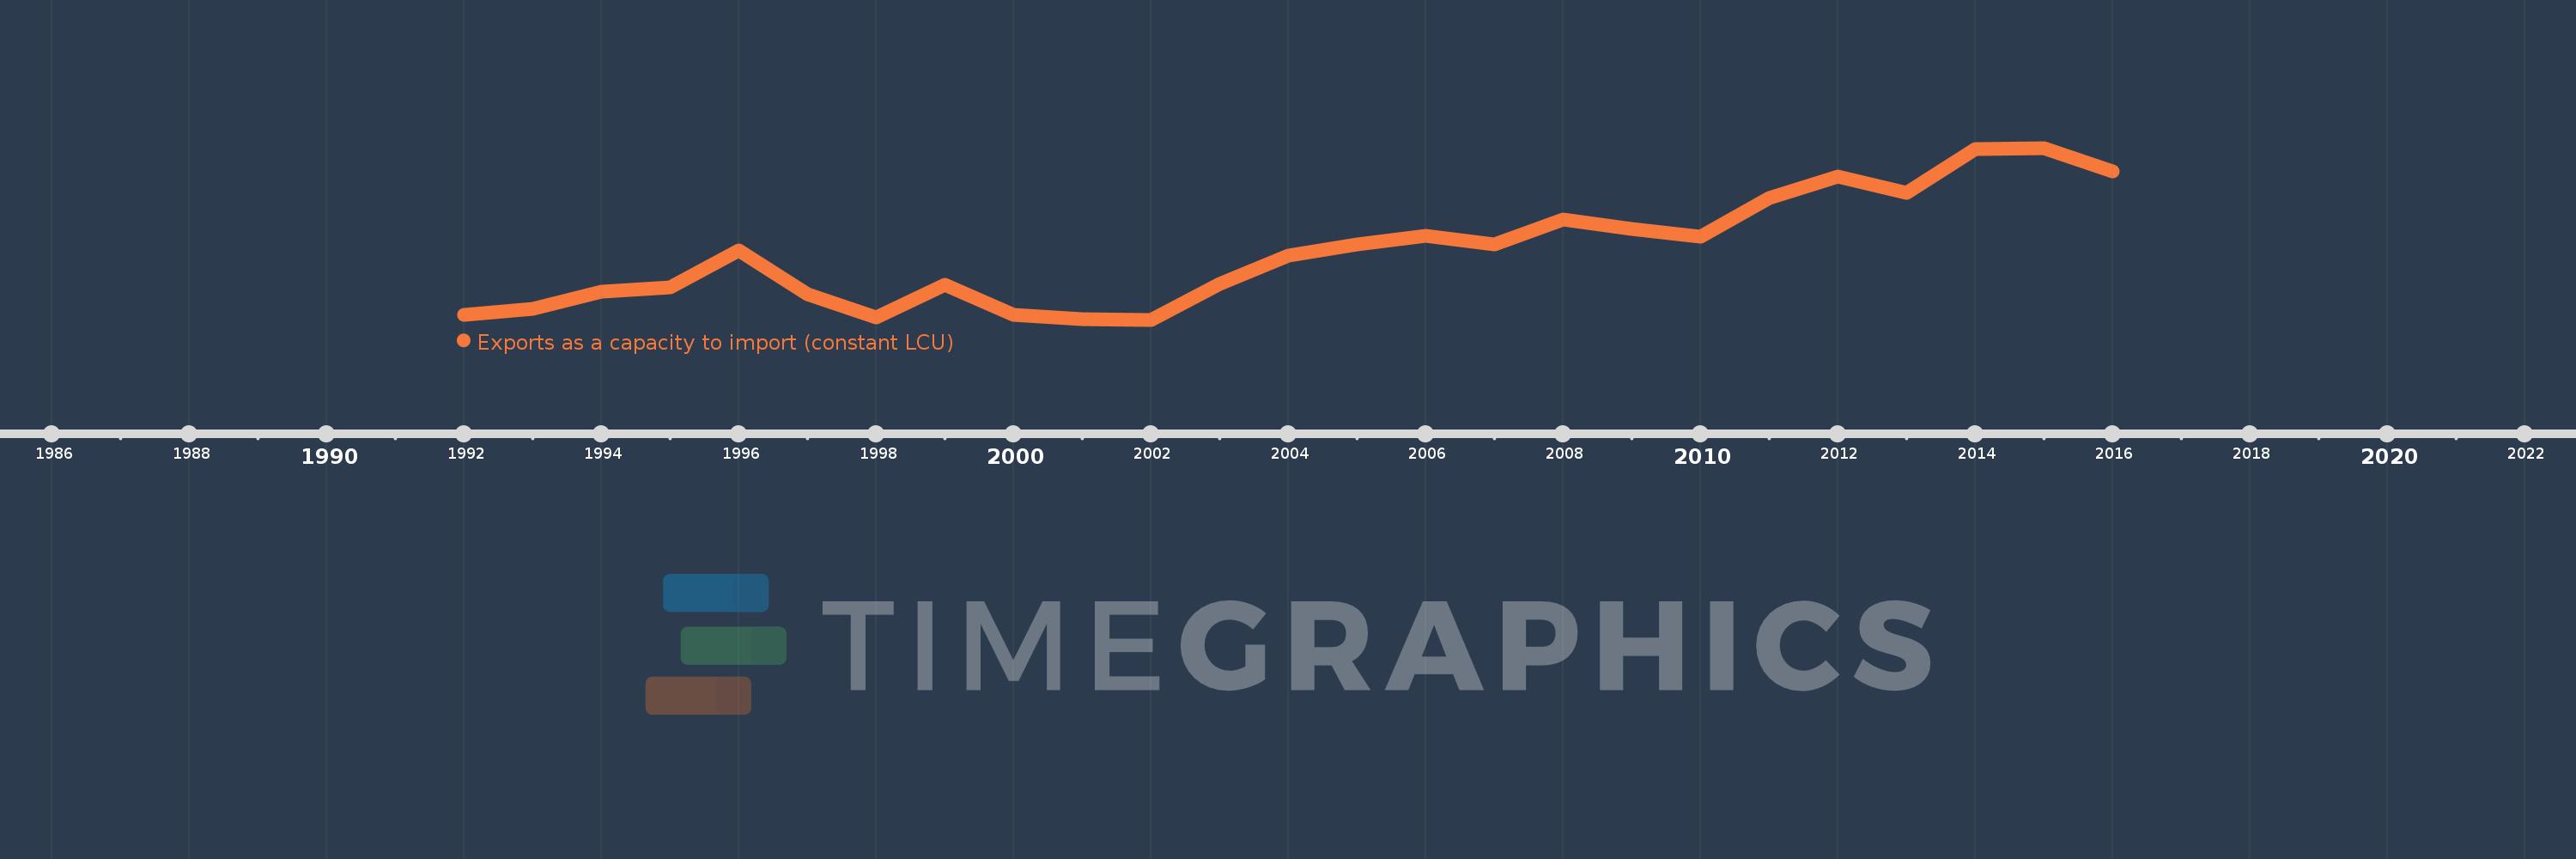
Exports as a capacity to import (constant LCU)
2016,2015,2014,2013,2012,2011,2010,2009,2008,2007,2006,2005,2004,2003,2002,2001,2000,1999,1998,1997,1996,1995,1994,1993,1992
This statistics in other country:
AlbaniaAlgeriaAngolaAntigua and BarbudaArgentinaArmeniaAustraliaAustriaAzerbaijanBahamas, TheBahrainBangladeshBarbadosBelarusBelgiumBelizeBeninBhutanBoliviaBosnia and HerzegovinaBotswanaBrazilBrunei DarussalamBulgariaBurkina FasoBurundiCabo VerdeCambodiaCameroonCanadaChadChileColombiaComorosCongo, Dem. Rep.Congo, Rep.Costa RicaCote d'IvoireCroatiaCubaCyprusCzech RepublicDenmarkDjiboutiDominican RepublicEcuadorEgypt, Arab Rep.El SalvadorEquatorial GuineaEritreaEstoniaEthiopiaFijiFinlandFranceGabonGambia, TheGeorgiaGermanyGhanaGreeceGuatemalaGuineaGuinea-BissauHaitiHondurasHong Kong SAR, ChinaHungaryIcelandIndiaIndonesiaIran, Islamic Rep.IrelandIsraelItalyJamaicaJapanJordanKazakhstanKenyaKorea, Rep.KosovoKuwaitKyrgyz RepublicLao PDRLatviaLebanonLiberiaLibyaLithuaniaLuxembourgMacao SAR, ChinaMacedonia, FYRMadagascarMalawiMalaysiaMaliMaltaMauritaniaMauritiusMexicoMoldovaMongoliaMontenegroMoroccoMozambiqueMyanmarNamibiaNepalNetherlandsNew ZealandNicaraguaNigerNigeriaNorwayOmanPakistanPanamaPapua New GuineaParaguayPeruPhilippinesPolandPortugalPuerto RicoQatarRomaniaRussian FederationRwandaSamoaSaudi ArabiaSenegalSerbiaSeychellesSierra LeoneSingaporeSlovak RepublicSloveniaSomaliaSouth AfricaSouth SudanSpainSri LankaSudanSurinameSwazilandSwedenSwitzerlandSyrian Arab RepublicTajikistanTanzaniaThailandTimor-LesteTogoTrinidad and TobagoTunisiaTurkeyTurkmenistanUgandaUkraineUnited Arab EmiratesUnited KingdomUnited StatesUruguayUzbekistanVanuatuVenezuela, RBVietnamWest Bank and GazaZambiaZimbabwe Timeline:
This timeline shows a graph from 1992 to 2016 of Paraguay. No data until 1991. Number of actual observations by date: 25.
Source name:
World Development Indicators
Source organization:
World Bank national accounts data, and OECD National Accounts data files.
Categories, topics:
Economy & Growth, Trade
Last updated:
apr 23, 2017
Indicators value changes by year
Minimum:
7.581 trl
jan 1, 2002
Maximum:
15.784 trl
jan 1, 2015
At the date of observation
Value
Absolute change
Change from previous value
jan 1, 1992
7.804 trl
+7.804 trl
0.0%
jan 1, 1993
8.097 trl
+293.178 bln
3.76%
jan 1, 1994
8.921 trl
+824.101 bln
10.18%
jan 1, 1995
9.118 trl
+197.162 bln
2.21%
jan 1, 1996
10.882 trl
+1.764 trl
19.34%
jan 1, 1997
8.799 trl
-2.084 trl
-19.15%
jan 1, 1998
7.673 trl
-1.126 trl
-12.8%
jan 1, 1999
9.24 trl
+1.567 trl
20.42%
jan 1, 2000
7.821 trl
-1.418 trl
-15.35%
jan 1, 2001
7.62 trl
-201.714 bln
-2.58%
jan 1, 2002
7.581 trl
-38.792 bln
-0.51%
jan 1, 2003
9.271 trl
+1.691 trl
22.3%
jan 1, 2004
10.643 trl
+1.372 trl
14.8%
jan 1, 2005
11.181 trl
+538.039 bln
5.06%
jan 1, 2006
11.568 trl
+386.799 bln
3.46%
jan 1, 2007
11.163 trl
-405.488 bln
-3.51%
jan 1, 2008
12.37 trl
+1.207 trl
10.82%
jan 1, 2009
11.933 trl
-437.504 bln
-3.54%
jan 1, 2010
11.536 trl
-396.381 bln
-3.32%
jan 1, 2011
13.38 trl
+1.844 trl
15.99%
jan 1, 2012
14.418 trl
+1.038 trl
7.75%
jan 1, 2013
13.65 trl
-768.034 bln
-5.33%
jan 1, 2014
15.733 trl
+2.083 trl
15.26%
jan 1, 2015
15.784 trl
+51.613 bln
0.33%
jan 1, 2016
14.683 trl
-1.101 trl
-6.98%
Ranking of countries by current statistics by years


Comments: