29
/
en
AIzaSyAYiBZKx7MnpbEhh9jyipgxe19OcubqV5w
April 1, 2024
160424
Israel
ISR
true
2
1
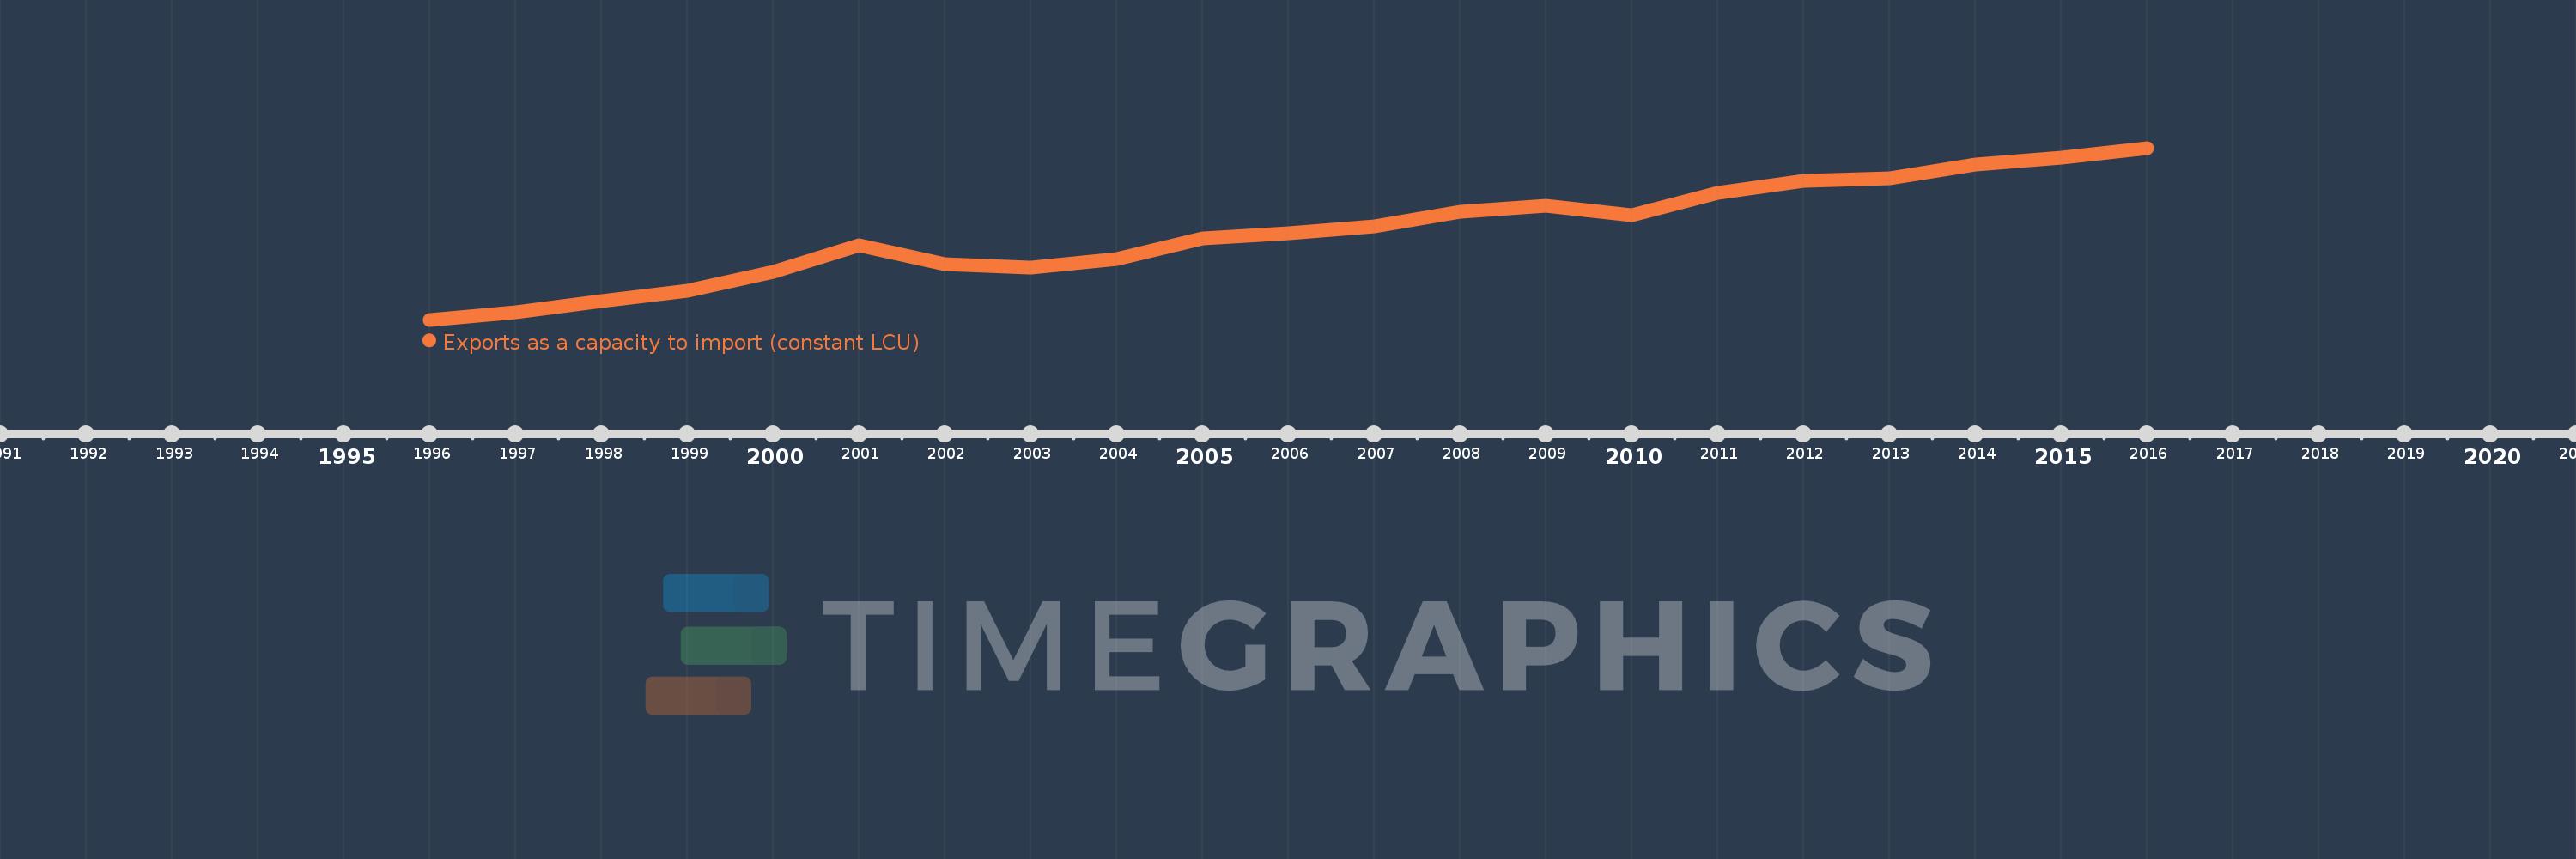
Exports as a capacity to import (constant LCU)
2016,2015,2014,2013,2012,2011,2010,2009,2008,2007,2006,2005,2004,2003,2002,2001,2000,1999,1998,1997,1996
This statistics in other country:
AlbaniaAlgeriaAngolaAntigua and BarbudaArgentinaArmeniaAustraliaAustriaAzerbaijanBahamas, TheBahrainBangladeshBarbadosBelarusBelgiumBelizeBeninBhutanBoliviaBosnia and HerzegovinaBotswanaBrazilBrunei DarussalamBulgariaBurkina FasoBurundiCabo VerdeCambodiaCameroonCanadaChadChileColombiaComorosCongo, Dem. Rep.Congo, Rep.Costa RicaCote d'IvoireCroatiaCubaCyprusCzech RepublicDenmarkDjiboutiDominican RepublicEcuadorEgypt, Arab Rep.El SalvadorEquatorial GuineaEritreaEstoniaEthiopiaFijiFinlandFranceGabonGambia, TheGeorgiaGermanyGhanaGreeceGuatemalaGuineaGuinea-BissauHaitiHondurasHong Kong SAR, ChinaHungaryIcelandIndiaIndonesiaIran, Islamic Rep.IrelandIsraelItalyJamaicaJapanJordanKazakhstanKenyaKorea, Rep.KosovoKuwaitKyrgyz RepublicLao PDRLatviaLebanonLiberiaLibyaLithuaniaLuxembourgMacao SAR, ChinaMacedonia, FYRMadagascarMalawiMalaysiaMaliMaltaMauritaniaMauritiusMexicoMoldovaMongoliaMontenegroMoroccoMozambiqueMyanmarNamibiaNepalNetherlandsNew ZealandNicaraguaNigerNigeriaNorwayOmanPakistanPanamaPapua New GuineaParaguayPeruPhilippinesPolandPortugalPuerto RicoQatarRomaniaRussian FederationRwandaSamoaSaudi ArabiaSenegalSerbiaSeychellesSierra LeoneSingaporeSlovak RepublicSloveniaSomaliaSouth AfricaSouth SudanSpainSri LankaSudanSurinameSwazilandSwedenSwitzerlandSyrian Arab RepublicTajikistanTanzaniaThailandTimor-LesteTogoTrinidad and TobagoTunisiaTurkeyTurkmenistanUgandaUkraineUnited Arab EmiratesUnited KingdomUnited StatesUruguayUzbekistanVanuatuVenezuela, RBVietnamWest Bank and GazaZambiaZimbabwe Timeline:
This timeline shows a graph from 1996 to 2016 of Israel. No data until 1995. Number of actual observations by date: 21.
Source name:
World Development Indicators
Source organization:
World Bank national accounts data, and OECD National Accounts data files.
Categories, topics:
Economy & Growth, Trade
Last updated:
apr 23, 2017
Indicators value changes by year
Minimum:
121.607 bln
jan 1, 1996
Maximum:
372.048 bln
jan 1, 2016
At the date of observation
Value
Absolute change
Change from previous value
jan 1, 1996
121.607 bln
+121.607 bln
0.0%
jan 1, 1997
132.298 bln
+10.69 bln
8.79%
jan 1, 1998
149.381 bln
+17.084 bln
12.91%
jan 1, 1999
163.437 bln
+14.055 bln
9.41%
jan 1, 2000
191.461 bln
+28.024 bln
17.15%
jan 1, 2001
230.477 bln
+39.015 bln
20.38%
jan 1, 2002
202.988 bln
-27.488 bln
-11.93%
jan 1, 2003
198.226 bln
-4.762 bln
-2.35%
jan 1, 2004
209.612 bln
+11.386 bln
5.74%
jan 1, 2005
240.179 bln
+30.567 bln
14.58%
jan 1, 2006
247.554 bln
+7.375 bln
3.07%
jan 1, 2007
257.686 bln
+10.132 bln
4.09%
jan 1, 2008
279.043 bln
+21.357 bln
8.29%
jan 1, 2009
287.745 bln
+8.702 bln
3.12%
jan 1, 2010
273.704 bln
-14.04 bln
-4.88%
jan 1, 2011
306.775 bln
+33.071 bln
12.08%
jan 1, 2012
324.336 bln
+17.561 bln
5.72%
jan 1, 2013
327.979 bln
+3.643 bln
1.12%
jan 1, 2014
348.253 bln
+20.274 bln
6.18%
jan 1, 2015
357.421 bln
+9.168 bln
2.63%
jan 1, 2016
372.048 bln
+14.627 bln
4.09%
Ranking of countries by current statistics by years


Comments: