29
/
en
AIzaSyAYiBZKx7MnpbEhh9jyipgxe19OcubqV5w
April 1, 2024
26215
Central Europe and the Baltics
CEB
false
2
1
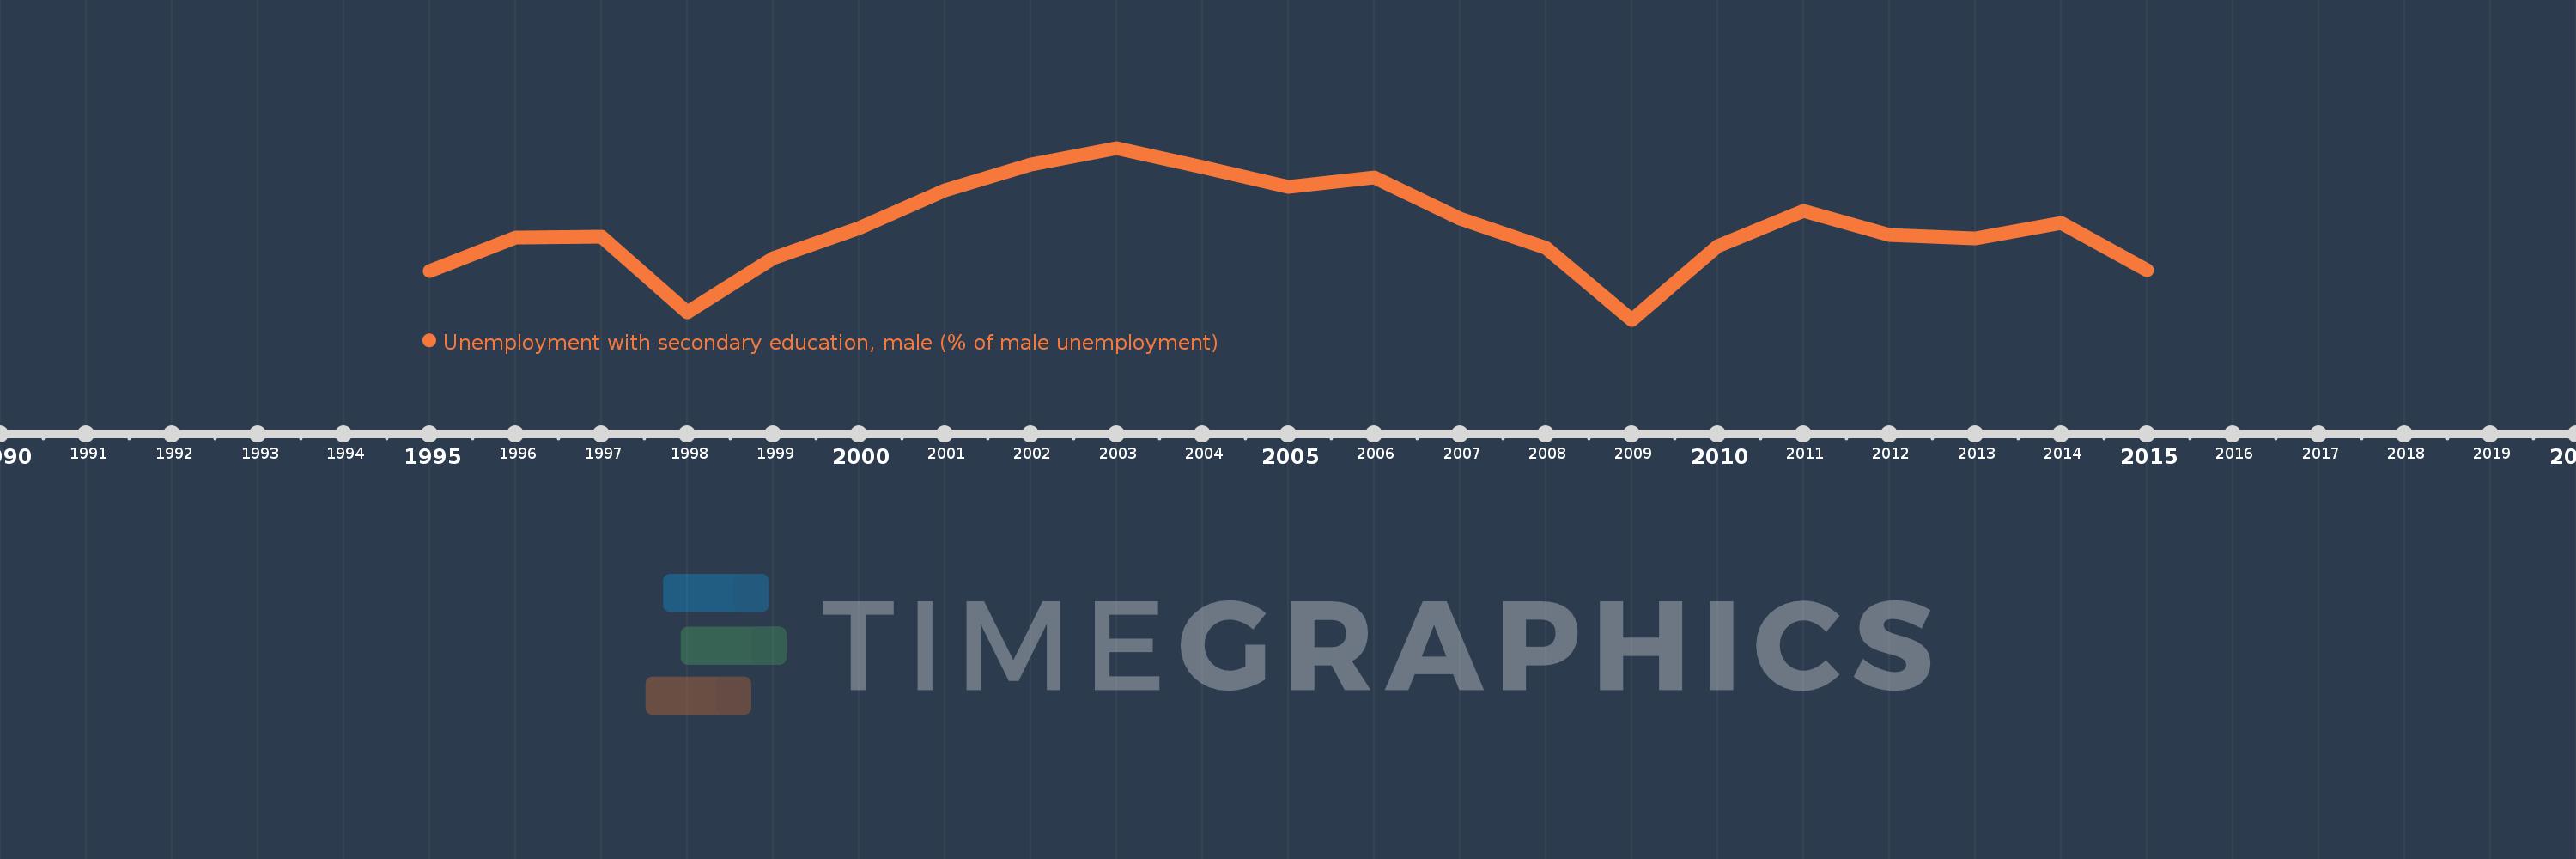
Unemployment with secondary education, male (% of male unemployment)
2015,2014,2013,2012,2011,2010,2009,2008,2007,2006,2005,2004,2003,2002,2001,2000,1999,1998,1997,1996,1995
This statistics in other country:
Timeline:
This timeline shows a graph from 1995 to 2015 of Central Europe and the Baltics. No data until 1994. Number of actual observations by date: 21.
Source name:
World Development Indicators
Source organization:
International Labour Organization, Key Indicators of the Labour Market database.
Categories, topics:
Social Protection & Labor, Gender
Last updated:
apr 23, 2017
Indicators value changes by year
Minimum:
64.928
jan 1, 2009
Maximum:
71.599
jan 1, 2003
At the date of observation
Value
Absolute change
Change from previous value
jan 1, 1995
66.809
+66.809
0.0%
jan 1, 1996
68.131
+1.322
1.98%
jan 1, 1997
68.14
+0.01
0.01%
jan 1, 1998
65.227
-2.913
-4.27%
jan 1, 1999
67.317
+2.09
3.2%
jan 1, 2000
68.502
+1.185
1.76%
jan 1, 2001
69.961
+1.459
2.13%
jan 1, 2002
70.947
+0.986
1.41%
jan 1, 2003
71.599
+0.652
0.92%
jan 1, 2004
70.868
-0.731
-1.02%
jan 1, 2005
70.078
-0.791
-1.12%
jan 1, 2006
70.44
+0.362
0.52%
jan 1, 2007
68.857
-1.583
-2.25%
jan 1, 2008
67.736
-1.121
-1.63%
jan 1, 2009
64.928
-2.808
-4.15%
jan 1, 2010
67.79
+2.862
4.41%
jan 1, 2011
69.149
+1.36
2.01%
jan 1, 2012
68.224
-0.925
-1.34%
jan 1, 2013
68.086
-0.138
-0.2%
jan 1, 2014
68.675
+0.589
0.86%
jan 1, 2015
66.847
-1.829
-2.66%
Ranking of countries by current statistics by years


Comments: