29
/
en
AIzaSyAYiBZKx7MnpbEhh9jyipgxe19OcubqV5w
April 1, 2024
131307
Ethiopia
ETH
true
2
1
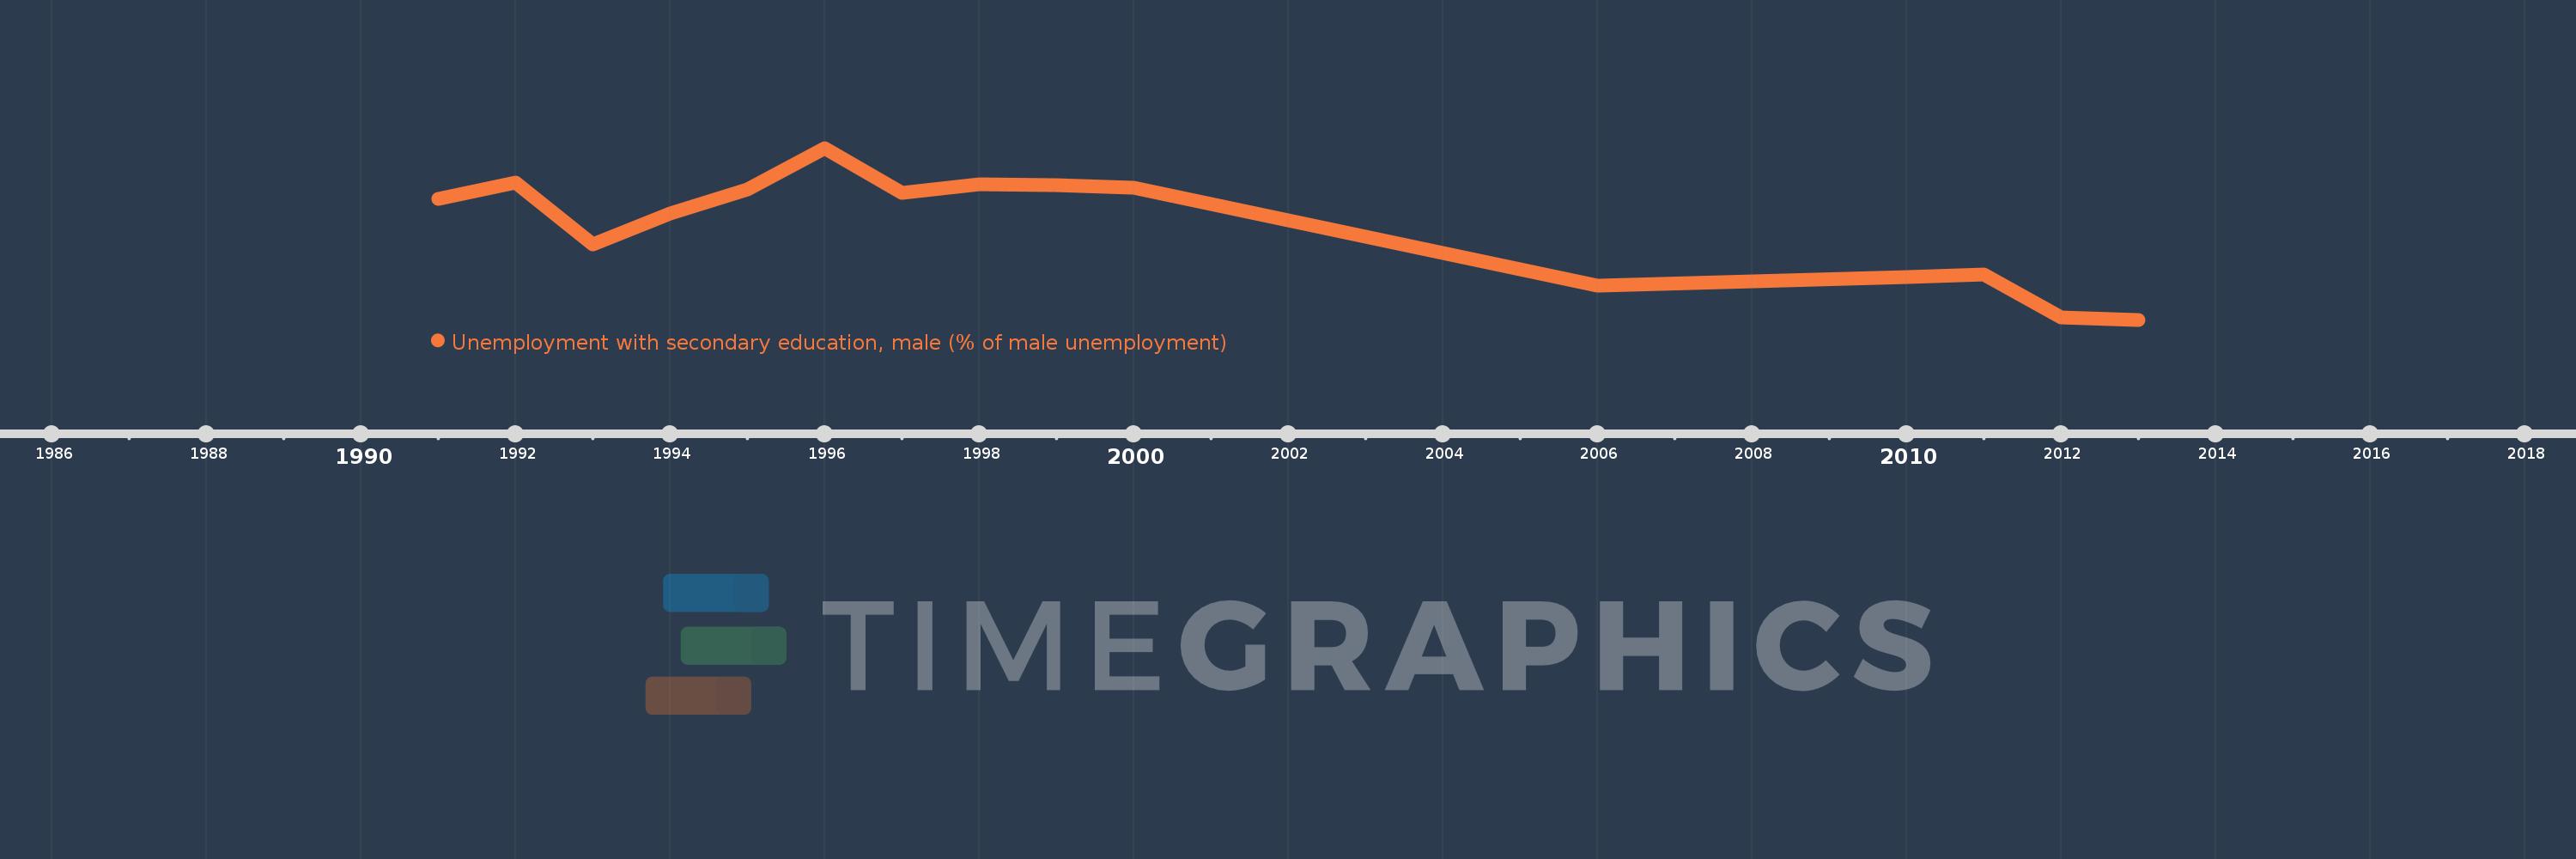
Unemployment with secondary education, male (% of male unemployment)
2013,2012,2011,2010,2006,2000,1999,1998,1997,1996,1995,1994,1993,1992,1991
This statistics in other country:
Timeline:
This timeline shows a graph from 1991 to 2013 of Ethiopia. No data until 1990. Number of actual observations by date: 15.
Source name:
World Development Indicators
Source organization:
International Labour Organization, Key Indicators of the Labour Market database.
Categories, topics:
Social Protection & Labor, Gender
Last updated:
apr 23, 2017
Indicators value changes by year
At the date of observation
Value
Absolute change
Change from previous value
jan 1, 1991
52.7
+52.7
0.0%
jan 1, 1992
58.9
+6.2
11.76%
jan 1, 1993
34.8
-24.1
-40.92%
jan 1, 1994
46.9
+12.1
34.77%
jan 1, 1995
56.2
+9.3
19.83%
jan 1, 1996
72.4
+16.2
28.83%
jan 1, 1997
54.9
-17.5
-24.17%
jan 1, 1998
58.4
+3.5
6.38%
jan 1, 1999
57.8
-0.6
-1.03%
jan 1, 2000
57.0
-0.8
-1.38%
jan 1, 2006
19.0
-38.0
-66.67%
jan 1, 2010
22.1
+3.1
16.32%
jan 1, 2011
23.2
+1.1
4.98%
jan 1, 2012
6.6
-16.6
-71.55%
jan 1, 2013
5.6
-1.0
-15.15%
Ranking of countries by current statistics by years


Comments: