29
/
en
AIzaSyAYiBZKx7MnpbEhh9jyipgxe19OcubqV5w
April 1, 2024
33961
European Union
EUU
false
2
1
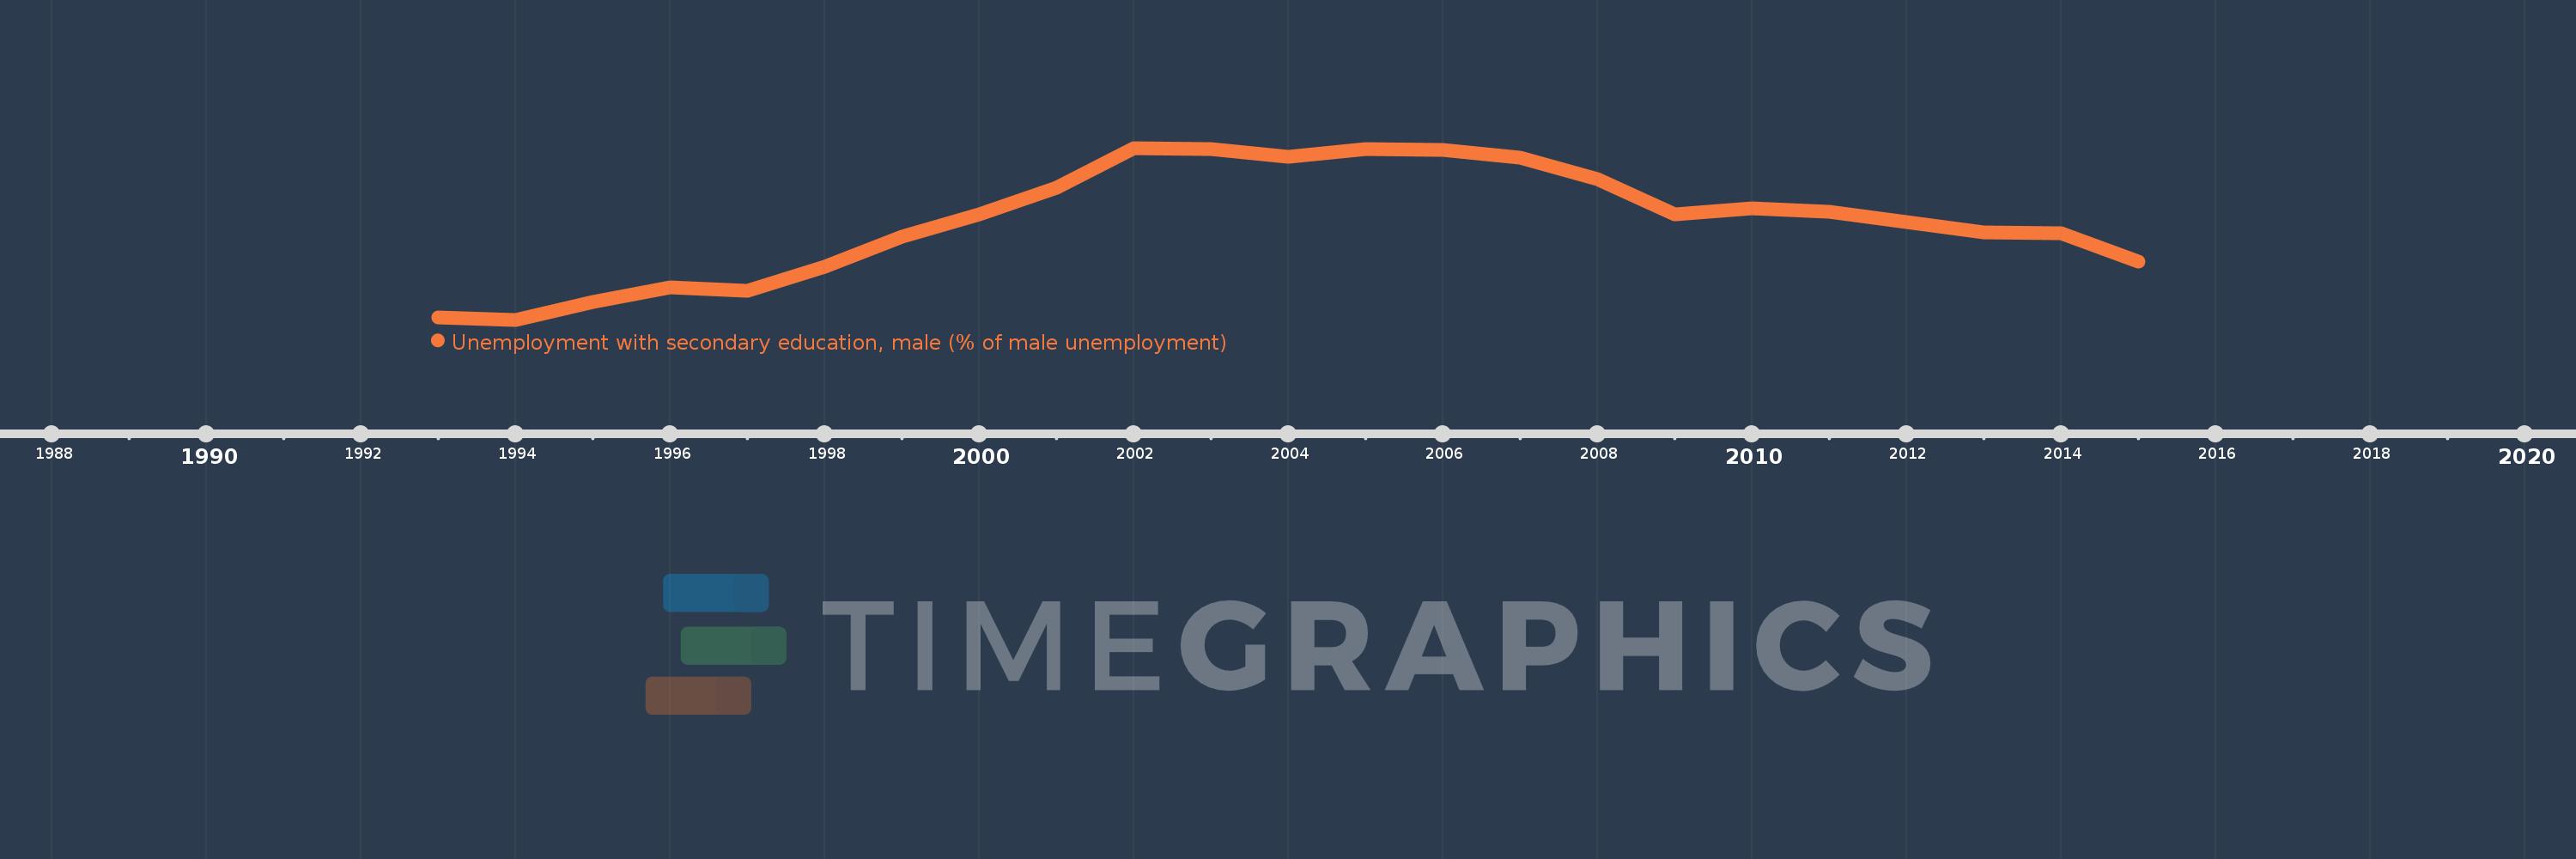
Unemployment with secondary education, male (% of male unemployment)
2015,2014,2013,2012,2011,2010,2009,2008,2007,2006,2005,2004,2003,2002,2001,2000,1999,1998,1997,1996,1995,1994,1993
This statistics in other country:
Timeline:
This timeline shows a graph from 1993 to 2015 of European Union. No data until 1992. Number of actual observations by date: 23.
Source name:
World Development Indicators
Source organization:
International Labour Organization, Key Indicators of the Labour Market database.
Categories, topics:
Social Protection & Labor, Gender
Last updated:
apr 23, 2017
Indicators value changes by year
Minimum:
39.267
jan 1, 1994
Maximum:
52.284
jan 1, 2002
At the date of observation
Value
Absolute change
Change from previous value
jan 1, 1993
39.436
+39.436
0.0%
jan 1, 1994
39.267
-0.168
-0.43%
jan 1, 1995
40.607
+1.34
3.41%
jan 1, 1996
41.693
+1.086
2.67%
jan 1, 1997
41.46
-0.232
-0.56%
jan 1, 1998
43.263
+1.803
4.35%
jan 1, 1999
45.584
+2.321
5.36%
jan 1, 2000
47.279
+1.696
3.72%
jan 1, 2001
49.269
+1.99
4.21%
jan 1, 2002
52.284
+3.015
6.12%
jan 1, 2003
52.204
-0.08
-0.15%
jan 1, 2004
51.611
-0.593
-1.14%
jan 1, 2005
52.177
+0.566
1.1%
jan 1, 2006
52.144
-0.033
-0.06%
jan 1, 2007
51.576
-0.568
-1.09%
jan 1, 2008
49.912
-1.664
-3.23%
jan 1, 2009
47.282
-2.63
-5.27%
jan 1, 2010
47.71
+0.428
0.91%
jan 1, 2011
47.466
-0.244
-0.51%
jan 1, 2012
46.683
-0.783
-1.65%
jan 1, 2013
45.859
-0.824
-1.77%
jan 1, 2014
45.811
-0.048
-0.11%
jan 1, 2015
43.672
-2.139
-4.67%
Ranking of countries by current statistics by years


Comments: