29
/
en
AIzaSyAYiBZKx7MnpbEhh9jyipgxe19OcubqV5w
April 1, 2024
257601
Switzerland
CHE
true
2
1
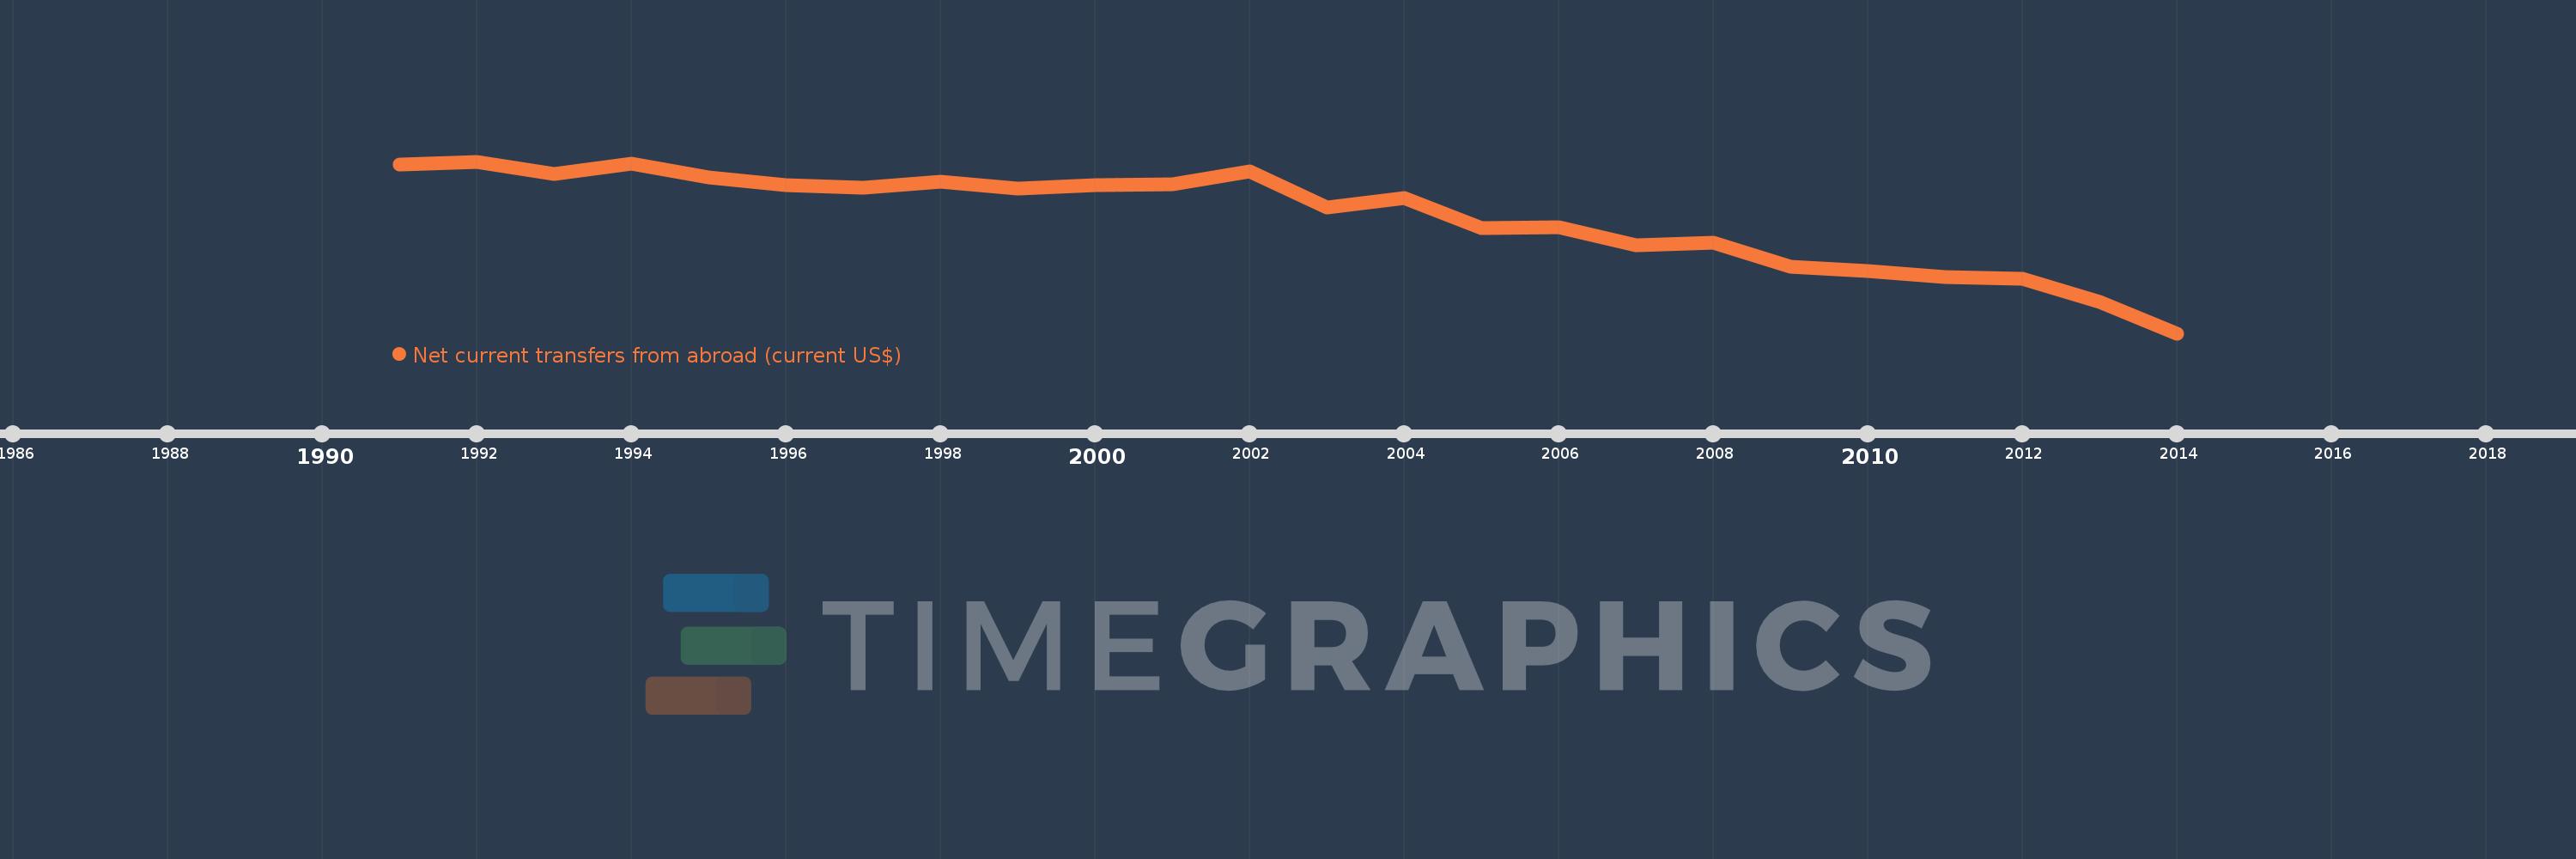
Net current transfers from abroad (current US$)
2014,2013,2012,2011,2010,2009,2008,2007,2006,2005,2004,2003,2002,2001,2000,1999,1998,1997,1996,1995,1994,1993,1992,1991
This statistics in other country:
AfghanistanAlbaniaAlgeriaAngolaAntigua and BarbudaArgentinaArmeniaAustraliaAustriaAzerbaijanBahamas, TheBangladeshBarbadosBelarusBelgiumBelizeBeninBermudaBhutanBoliviaBosnia and HerzegovinaBotswanaBrazilBrunei DarussalamBulgariaBurkina FasoBurundiCabo VerdeCambodiaCameroonCanadaCentral African RepublicChadChileChinaColombiaComorosCongo, Dem. Rep.Congo, Rep.Costa RicaCote d'IvoireCroatiaCzech RepublicDenmarkDjiboutiDominicaDominican RepublicEcuadorEgypt, Arab Rep.El SalvadorEquatorial GuineaEritreaEstoniaEthiopiaFaroe IslandsFijiFinlandFranceFrench PolynesiaGabonGambia, TheGeorgiaGermanyGhanaGreeceGrenadaGuatemalaGuineaGuinea-BissauGuyanaHaitiHondurasHong Kong SAR, ChinaHungaryIcelandIndiaIndonesiaIran, Islamic Rep.IraqIrelandIsraelItalyJamaicaJapanJordanKazakhstanKenyaKiribatiKorea, Rep.KosovoKyrgyz RepublicLao PDRLatviaLebanonLesothoLiberiaLibyaLithuaniaMacedonia, FYRMadagascarMalawiMalaysiaMaldivesMaliMauritaniaMauritiusMexicoMoldovaMongoliaMontenegroMoroccoMozambiqueMyanmarNamibiaNepalNetherlandsNew ZealandNicaraguaNigerNigeriaNorwayPakistanPalauPanamaPapua New GuineaParaguayPeruPhilippinesPolandPortugalRomaniaRussian FederationRwandaSamoaSao Tome and PrincipeSenegalSerbiaSeychellesSierra LeoneSingaporeSlovak RepublicSloveniaSolomon IslandsSouth AfricaSouth SudanSpainSri LankaSt. Kitts and NevisSt. LuciaSt. Vincent and the GrenadinesSudanSurinameSwazilandSwedenSwitzerlandSyrian Arab RepublicTajikistanTanzaniaThailandTimor-LesteTogoTongaTrinidad and TobagoTunisiaTurkeyTurkmenistanUgandaUkraineUnited KingdomUnited StatesUruguayUzbekistanVanuatuVenezuela, RBVietnamWest Bank and GazaYemen, Rep.ZambiaZimbabwe Timeline:
This timeline shows a graph from 1991 to 2014 of Switzerland. No data until 1990. Number of actual observations by date: 24.
Source name:
World Development Indicators
Source organization:
World Bank national accounts data, and OECD National Accounts data files.
Categories, topics:
Economy & Growth
Last updated:
apr 23, 2017
Indicators value changes by year
Minimum:
-17.225 bln
jan 1, 2014
Maximum:
-1.534 bln
jan 1, 1992
At the date of observation
Value
Absolute change
Change from previous value
jan 1, 1991
-1.839 bln
-1.839 bln
0.0%
jan 1, 1992
-1.534 bln
+304.484 mln
-16.56%
jan 1, 1993
-2.656 bln
-1.122 bln
73.1%
jan 1, 1994
-1.764 bln
+891.629 mln
-33.57%
jan 1, 1995
-2.961 bln
-1.197 bln
67.87%
jan 1, 1996
-3.703 bln
-741.738 mln
25.05%
jan 1, 1997
-3.928 bln
-224.859 mln
6.07%
jan 1, 1998
-3.378 bln
+549.56 mln
-13.99%
jan 1, 1999
-3.976 bln
-597.51 mln
17.69%
jan 1, 2000
-3.723 bln
+252.818 mln
-6.36%
jan 1, 2001
-3.647 bln
+75.787 mln
-2.04%
jan 1, 2002
-2.443 bln
+1.204 bln
-33.02%
jan 1, 2003
-5.734 bln
-3.291 bln
134.71%
jan 1, 2004
-4.867 bln
+866.288 mln
-15.11%
jan 1, 2005
-7.593 bln
-2.725 bln
55.99%
jan 1, 2006
-7.558 bln
+34.299 mln
-0.45%
jan 1, 2007
-9.17 bln
-1.612 bln
21.32%
jan 1, 2008
-8.977 bln
+193.601 mln
-2.11%
jan 1, 2009
-11.136 bln
-2.159 bln
24.05%
jan 1, 2010
-11.523 bln
-387.497 mln
3.48%
jan 1, 2011
-12.119 bln
-595.615 mln
5.17%
jan 1, 2012
-12.234 bln
-115.307 mln
0.95%
jan 1, 2013
-14.337 bln
-2.103 bln
17.19%
jan 1, 2014
-17.225 bln
-2.888 bln
20.14%
Ranking of countries by current statistics by years


Comments: