29
/
en
AIzaSyAYiBZKx7MnpbEhh9jyipgxe19OcubqV5w
April 1, 2024
273952
Ukraine
UKR
true
2
1
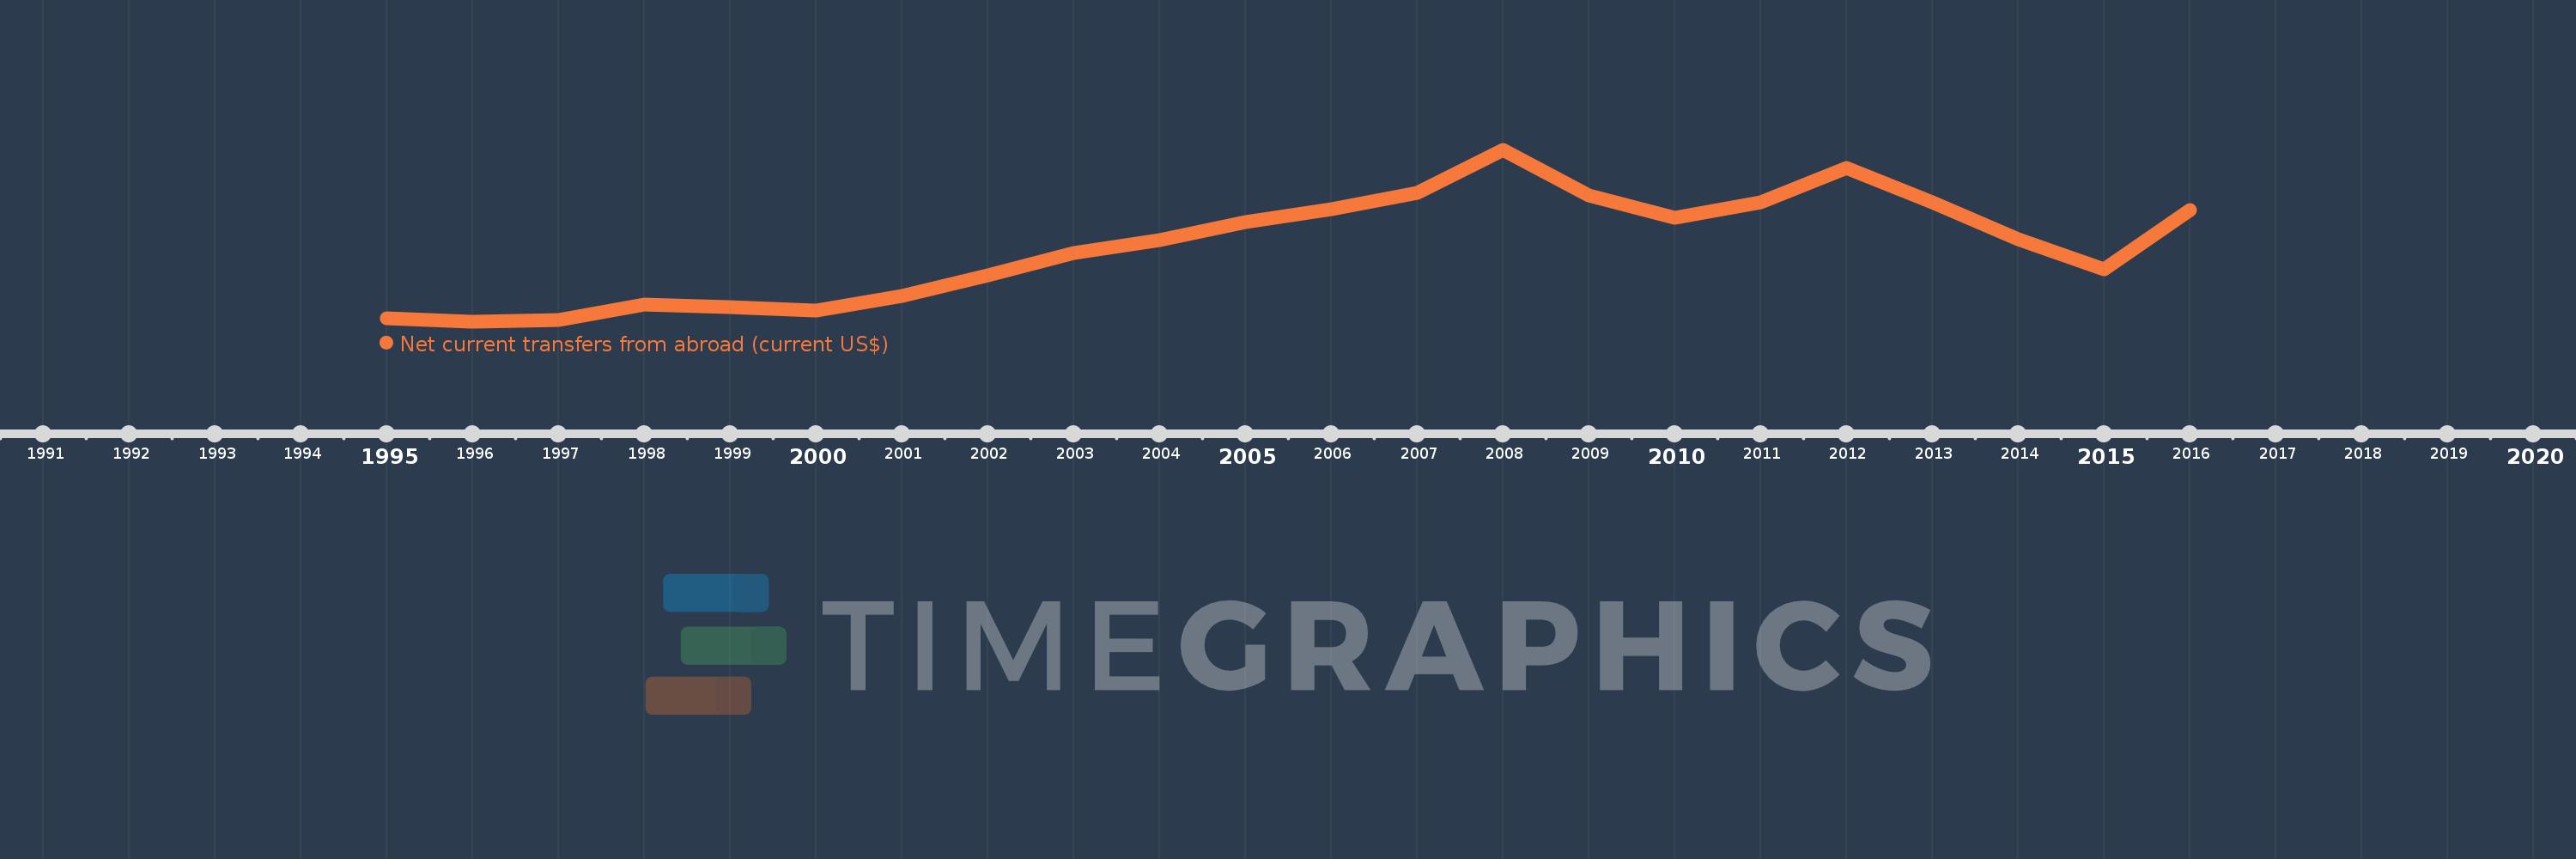
Net current transfers from abroad (current US$)
2016,2015,2014,2013,2012,2011,2010,2009,2008,2007,2006,2005,2004,2003,2002,2001,2000,1999,1998,1997,1996,1995
This statistics in other country:
AfghanistanAlbaniaAlgeriaAngolaAntigua and BarbudaArgentinaArmeniaAustraliaAustriaAzerbaijanBahamas, TheBangladeshBarbadosBelarusBelgiumBelizeBeninBermudaBhutanBoliviaBosnia and HerzegovinaBotswanaBrazilBrunei DarussalamBulgariaBurkina FasoBurundiCabo VerdeCambodiaCameroonCanadaCentral African RepublicChadChileChinaColombiaComorosCongo, Dem. Rep.Congo, Rep.Costa RicaCote d'IvoireCroatiaCzech RepublicDenmarkDjiboutiDominicaDominican RepublicEcuadorEgypt, Arab Rep.El SalvadorEquatorial GuineaEritreaEstoniaEthiopiaFaroe IslandsFijiFinlandFranceFrench PolynesiaGabonGambia, TheGeorgiaGermanyGhanaGreeceGrenadaGuatemalaGuineaGuinea-BissauGuyanaHaitiHondurasHong Kong SAR, ChinaHungaryIcelandIndiaIndonesiaIran, Islamic Rep.IraqIrelandIsraelItalyJamaicaJapanJordanKazakhstanKenyaKiribatiKorea, Rep.KosovoKyrgyz RepublicLao PDRLatviaLebanonLesothoLiberiaLibyaLithuaniaMacedonia, FYRMadagascarMalawiMalaysiaMaldivesMaliMauritaniaMauritiusMexicoMoldovaMongoliaMontenegroMoroccoMozambiqueMyanmarNamibiaNepalNetherlandsNew ZealandNicaraguaNigerNigeriaNorwayPakistanPalauPanamaPapua New GuineaParaguayPeruPhilippinesPolandPortugalRomaniaRussian FederationRwandaSamoaSao Tome and PrincipeSenegalSerbiaSeychellesSierra LeoneSingaporeSlovak RepublicSloveniaSolomon IslandsSouth AfricaSouth SudanSpainSri LankaSt. Kitts and NevisSt. LuciaSt. Vincent and the GrenadinesSudanSurinameSwazilandSwedenSwitzerlandSyrian Arab RepublicTajikistanTanzaniaThailandTimor-LesteTogoTongaTrinidad and TobagoTunisiaTurkeyTurkmenistanUgandaUkraineUnited KingdomUnited StatesUruguayUzbekistanVanuatuVenezuela, RBVietnamWest Bank and GazaYemen, Rep.ZambiaZimbabwe Timeline:
This timeline shows a graph from 1995 to 2016 of Ukraine. No data until 1994. Number of actual observations by date: 22.
Source name:
World Development Indicators
Source organization:
World Bank national accounts data, and OECD National Accounts data files.
Categories, topics:
Economy & Growth
Last updated:
apr 23, 2017
Indicators value changes by year
Minimum:
472.009 mln
jan 1, 1996
Maximum:
4.075 bln
jan 1, 2008
At the date of observation
Value
Absolute change
Change from previous value
jan 1, 1995
546.936 mln
+546.936 mln
0.0%
jan 1, 1996
472.009 mln
-74.927 mln
-13.7%
jan 1, 1997
509.0 mln
+36.991 mln
7.84%
jan 1, 1998
845.0 mln
+336.0 mln
66.01%
jan 1, 1999
782.0 mln
-63.0 mln
-7.46%
jan 1, 2000
706.007 mln
-75.993 mln
-9.72%
jan 1, 2001
1.017 bln
+310.954 mln
44.04%
jan 1, 2002
1.456 bln
+439.039 mln
43.17%
jan 1, 2003
1.922 bln
+466.0 mln
32.01%
jan 1, 2004
2.184 bln
+262.0 mln
13.63%
jan 1, 2005
2.576 bln
+392.0 mln
17.95%
jan 1, 2006
2.845 bln
+269.0 mln
10.44%
jan 1, 2007
3.173 bln
+328.0 mln
11.53%
jan 1, 2008
4.075 bln
+902.0 mln
28.43%
jan 1, 2009
3.127 bln
-948.0 mln
-23.26%
jan 1, 2010
2.661 bln
-466.0 mln
-14.9%
jan 1, 2011
2.975 bln
+314.0 mln
11.8%
jan 1, 2012
3.708 bln
+733.0 mln
24.64%
jan 1, 2013
2.979 bln
-728.648 mln
-19.65%
jan 1, 2014
2.205 bln
-774.698 mln
-26.0%
jan 1, 2015
1.569 bln
-636.002 mln
-28.85%
jan 1, 2016
2.815 bln
+1.246 bln
79.46%
Ranking of countries by current statistics by years


Comments: