29
/
en
AIzaSyAYiBZKx7MnpbEhh9jyipgxe19OcubqV5w
April 1, 2024
237467
Serbia
SRB
true
2
1
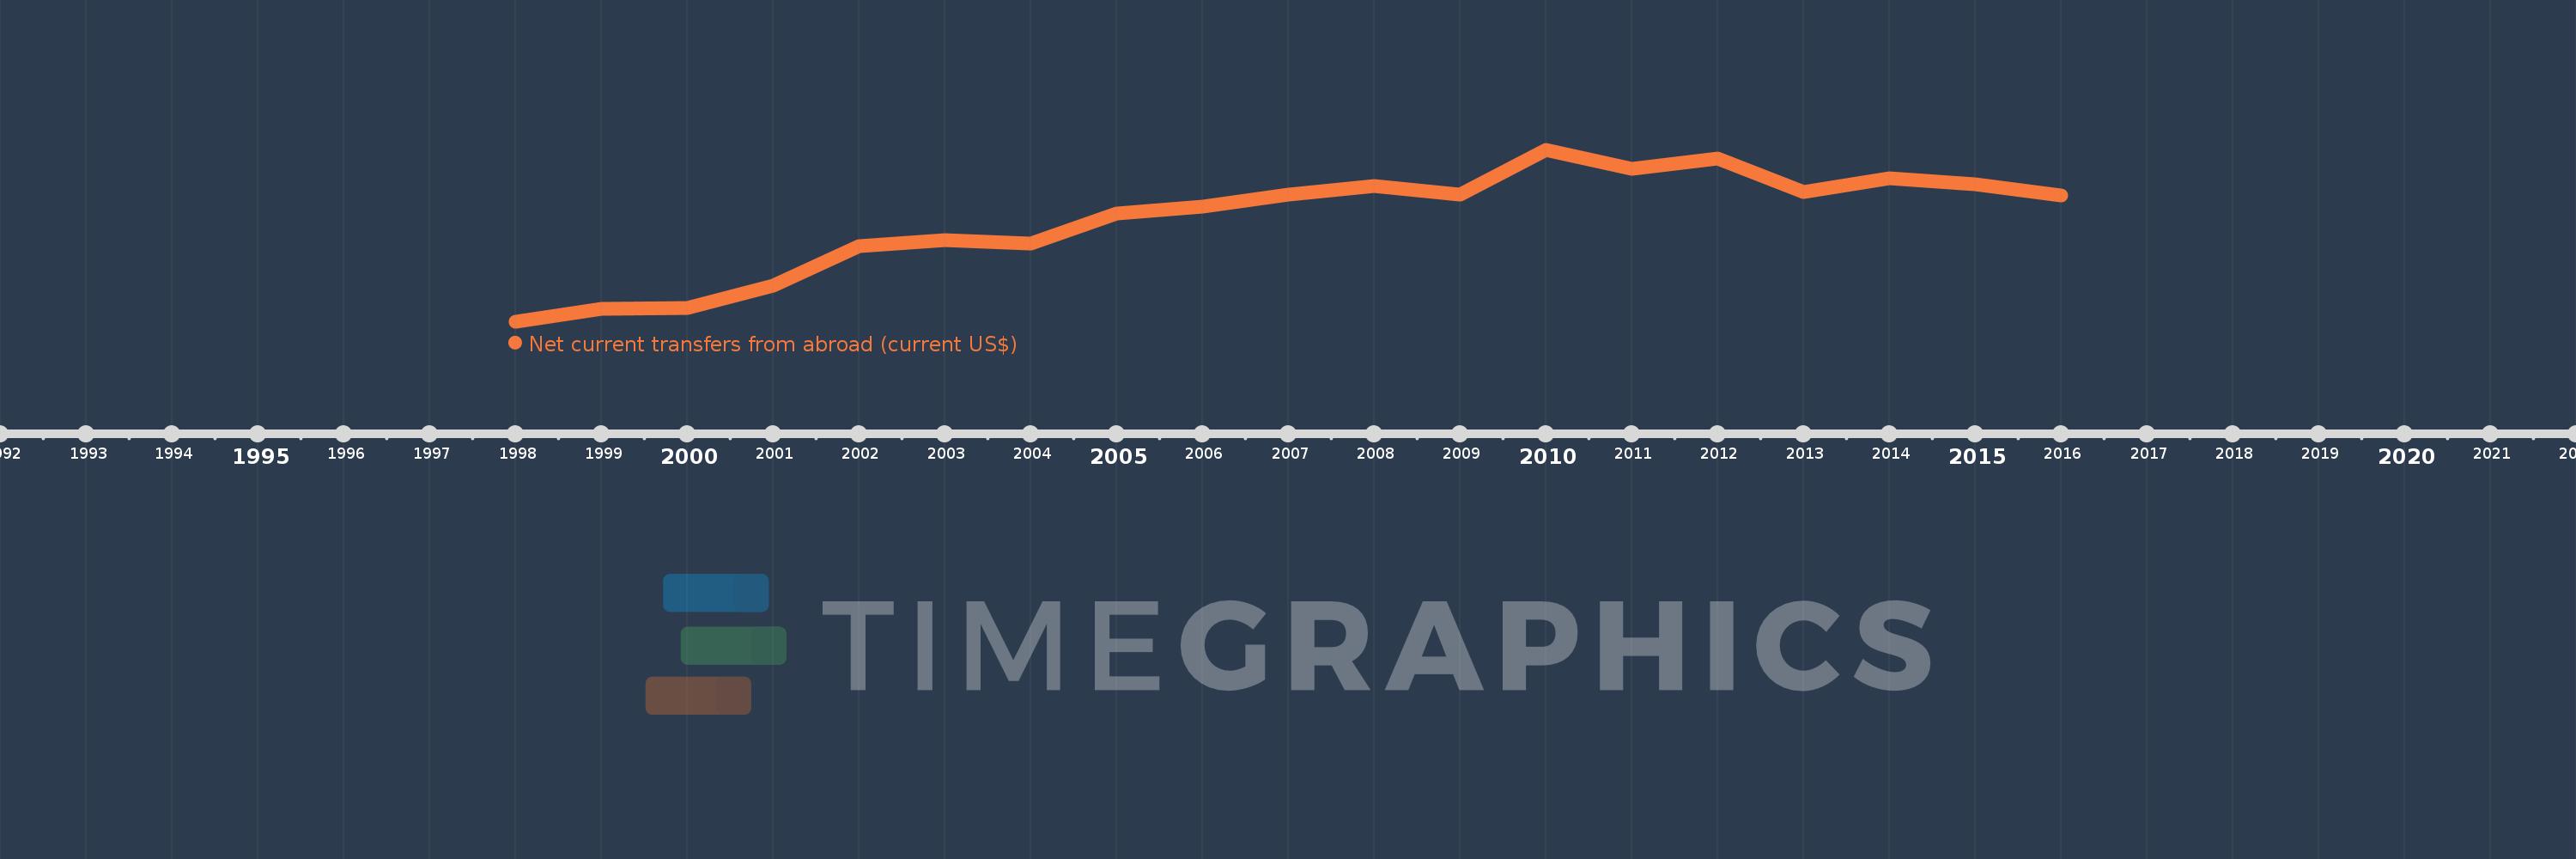
Net current transfers from abroad (current US$)
2016,2015,2014,2013,2012,2011,2010,2009,2008,2007,2006,2005,2004,2003,2002,2001,2000,1999,1998
This statistics in other country:
AfghanistanAlbaniaAlgeriaAngolaAntigua and BarbudaArgentinaArmeniaAustraliaAustriaAzerbaijanBahamas, TheBangladeshBarbadosBelarusBelgiumBelizeBeninBermudaBhutanBoliviaBosnia and HerzegovinaBotswanaBrazilBrunei DarussalamBulgariaBurkina FasoBurundiCabo VerdeCambodiaCameroonCanadaCentral African RepublicChadChileChinaColombiaComorosCongo, Dem. Rep.Congo, Rep.Costa RicaCote d'IvoireCroatiaCzech RepublicDenmarkDjiboutiDominicaDominican RepublicEcuadorEgypt, Arab Rep.El SalvadorEquatorial GuineaEritreaEstoniaEthiopiaFaroe IslandsFijiFinlandFranceFrench PolynesiaGabonGambia, TheGeorgiaGermanyGhanaGreeceGrenadaGuatemalaGuineaGuinea-BissauGuyanaHaitiHondurasHong Kong SAR, ChinaHungaryIcelandIndiaIndonesiaIran, Islamic Rep.IraqIrelandIsraelItalyJamaicaJapanJordanKazakhstanKenyaKiribatiKorea, Rep.KosovoKyrgyz RepublicLao PDRLatviaLebanonLesothoLiberiaLibyaLithuaniaMacedonia, FYRMadagascarMalawiMalaysiaMaldivesMaliMauritaniaMauritiusMexicoMoldovaMongoliaMontenegroMoroccoMozambiqueMyanmarNamibiaNepalNetherlandsNew ZealandNicaraguaNigerNigeriaNorwayPakistanPalauPanamaPapua New GuineaParaguayPeruPhilippinesPolandPortugalRomaniaRussian FederationRwandaSamoaSao Tome and PrincipeSenegalSerbiaSeychellesSierra LeoneSingaporeSlovak RepublicSloveniaSolomon IslandsSouth AfricaSouth SudanSpainSri LankaSt. Kitts and NevisSt. LuciaSt. Vincent and the GrenadinesSudanSurinameSwazilandSwedenSwitzerlandSyrian Arab RepublicTajikistanTanzaniaThailandTimor-LesteTogoTongaTrinidad and TobagoTunisiaTurkeyTurkmenistanUgandaUkraineUnited KingdomUnited StatesUruguayUzbekistanVanuatuVenezuela, RBVietnamWest Bank and GazaYemen, Rep.ZambiaZimbabwe Timeline:
This timeline shows a graph from 1998 to 2016 of Serbia. No data until 1997. Number of actual observations by date: 19.
Source name:
World Development Indicators
Source organization:
World Bank national accounts data, and OECD National Accounts data files.
Categories, topics:
Economy & Growth
Last updated:
apr 23, 2017
Indicators value changes by year
Minimum:
298.0 mln
jan 1, 1998
Maximum:
4.941 bln
jan 1, 2010
At the date of observation
Value
Absolute change
Change from previous value
jan 1, 1998
298.0 mln
+298.0 mln
0.0%
jan 1, 1999
654.0 mln
+356.0 mln
119.46%
jan 1, 2000
665.0 mln
+11.0 mln
1.68%
jan 1, 2001
1.289 bln
+624.0 mln
93.83%
jan 1, 2002
2.338 bln
+1.049 bln
81.38%
jan 1, 2003
2.521 bln
+183.0 mln
7.83%
jan 1, 2004
2.423 bln
-98.0 mln
-3.89%
jan 1, 2005
3.239 bln
+816.0 mln
33.68%
jan 1, 2006
3.426 bln
+187.0 mln
5.77%
jan 1, 2007
3.752 bln
+325.697 mln
9.51%
jan 1, 2008
3.974 bln
+222.509 mln
5.93%
jan 1, 2009
3.746 bln
-228.033 mln
-5.74%
jan 1, 2010
4.941 bln
+1.195 bln
31.9%
jan 1, 2011
4.432 bln
-509.804 mln
-10.32%
jan 1, 2012
4.716 bln
+284.943 mln
6.43%
jan 1, 2013
3.8 bln
-916.085 mln
-19.42%
jan 1, 2014
4.189 bln
+389.105 mln
10.24%
jan 1, 2015
4.008 bln
-181.345 mln
-4.33%
jan 1, 2016
3.712 bln
-296.134 mln
-7.39%
Ranking of countries by current statistics by years


Comments: