29
/
en
AIzaSyAYiBZKx7MnpbEhh9jyipgxe19OcubqV5w
April 1, 2024
257416
Switzerland
CHE
true
2
1
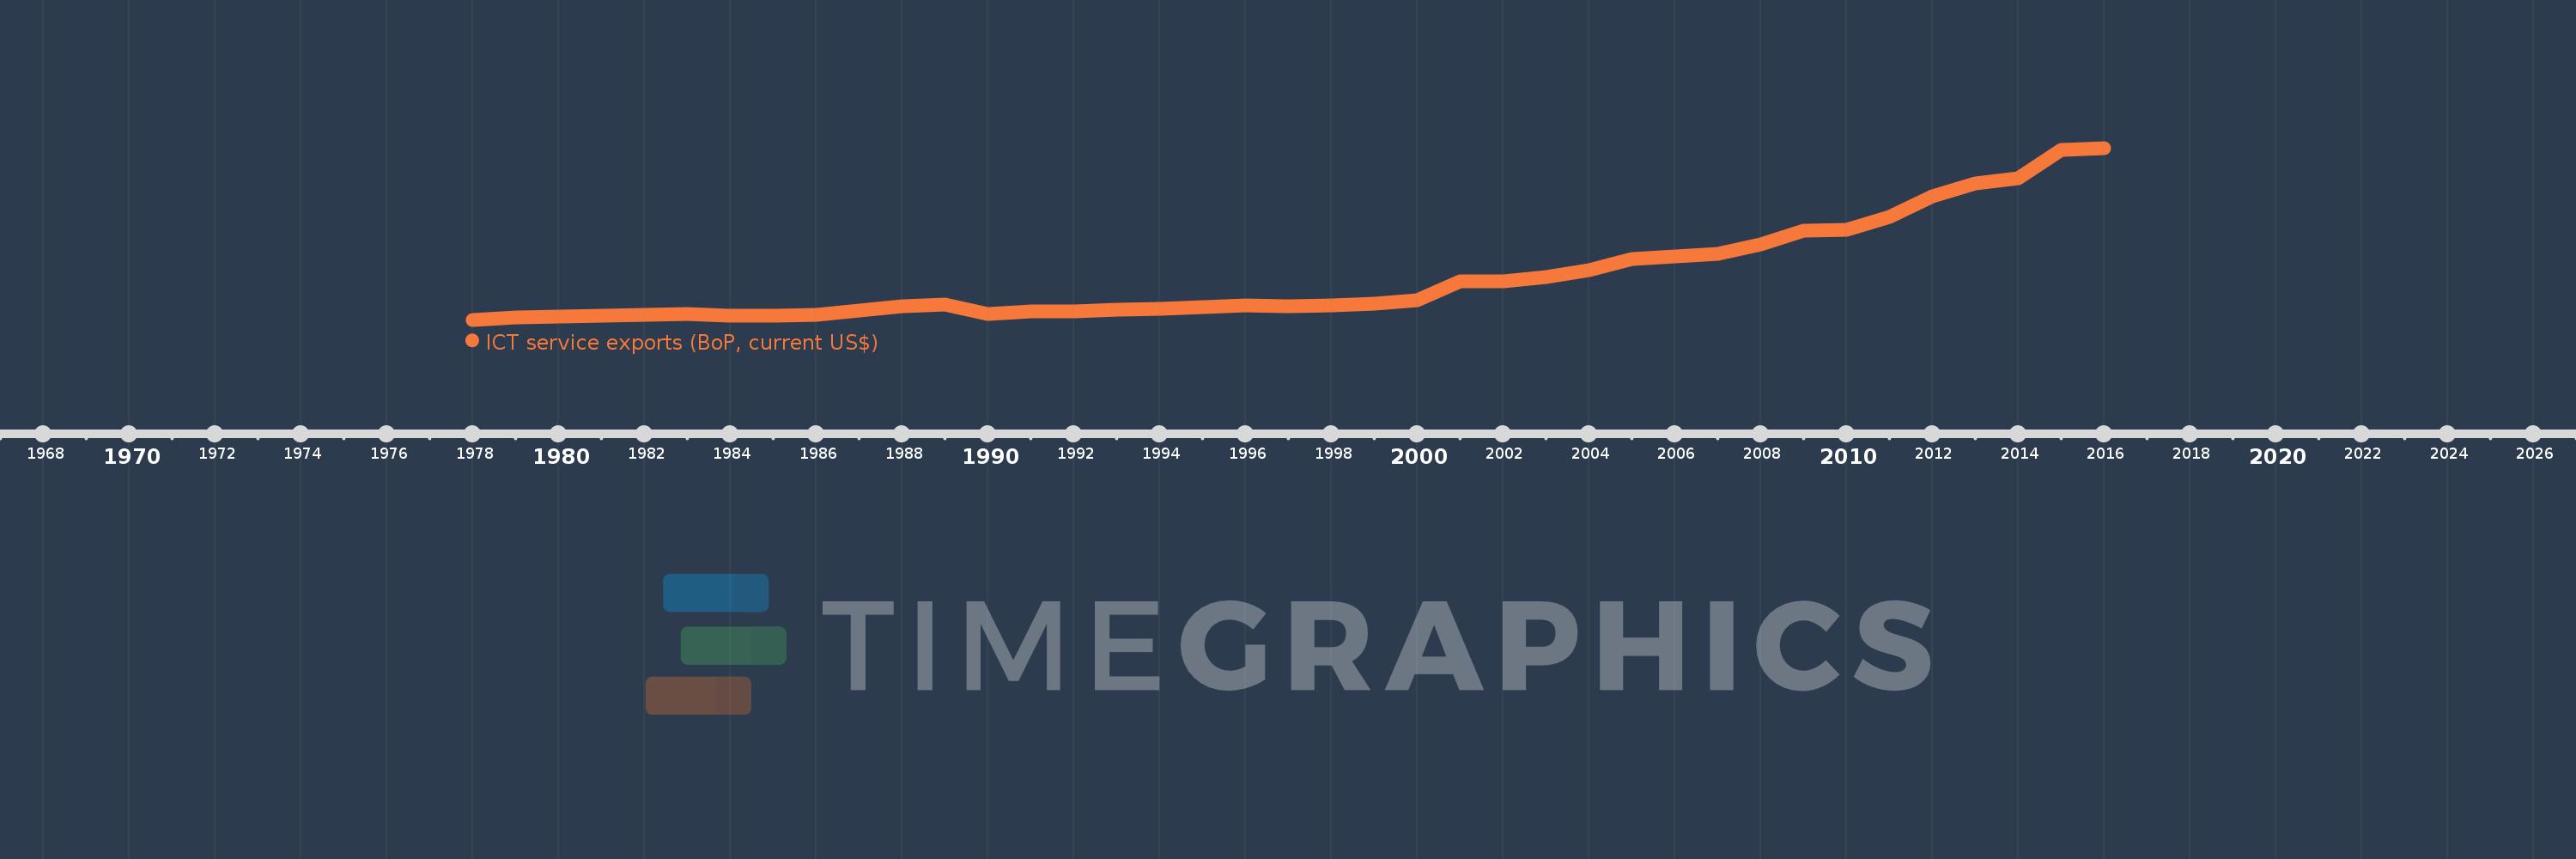
ICT service exports (BoP, current US$)
2016,2015,2014,2013,2012,2011,2010,2009,2008,2007,2006,2005,2004,2003,2002,2001,2000,1999,1998,1997,1996,1995,1994,1993,1992,1991,1990,1989,1988,1987,1986,1985,1984,1983,1982,1981,1980,1979,1978
This statistics in other country:
AfghanistanAlbaniaAlgeriaAngolaAntigua and BarbudaArab WorldArgentinaArmeniaArubaAustraliaAustriaAzerbaijanBahrainBangladeshBarbadosBelarusBelgiumBelizeBeninBermudaBhutanBoliviaBosnia and HerzegovinaBotswanaBrazilBrunei DarussalamBulgariaBurkina FasoBurundiCabo VerdeCambodiaCameroonCanadaCaribbean small statesCentral Europe and the BalticsChileChinaColombiaComorosCongo, Dem. Rep.Congo, Rep.Costa RicaCote d'IvoireCroatiaCuracaoCyprusCzech RepublicDenmarkDjiboutiDominicaDominican RepublicEarly-demographic dividendEast Asia & PacificEast Asia & Pacific (excluding high income)East Asia & Pacific (IDA & IBRD countries)EcuadorEgypt, Arab Rep.El SalvadorEritreaEstoniaEthiopiaEuro areaEurope & Central AsiaEurope & Central Asia (excluding high income)Europe & Central Asia (IDA & IBRD countries)European UnionFaroe IslandsFijiFinlandFragile and conflict affected situationsFranceFrench PolynesiaGabonGambia, TheGeorgiaGermanyGreeceGrenadaGuatemalaGuineaGuinea-BissauGuyanaHeavily indebted poor countries (HIPC)High incomeHondurasHong Kong SAR, ChinaHungaryIBRD onlyIcelandIDA & IBRD totalIDA blendIDA onlyIDA totalIndiaIndonesiaIraqIrelandIsraelItalyJamaicaJapanJordanKazakhstanKenyaKorea, Rep.KosovoKuwaitKyrgyz RepublicLao PDRLate-demographic dividendLatin America & Caribbean Latin America & Caribbean (excluding high income)Latin America & the Caribbean (IDA & IBRD countries)LatviaLeast developed countries: UN classificationLebanonLesothoLithuaniaLow & middle incomeLow incomeLower middle incomeLuxembourgMacao SAR, ChinaMacedonia, FYRMadagascarMalawiMalaysiaMaliMaltaMauritaniaMauritiusMexicoMicronesia, Fed. Sts.Middle East & North AfricaMiddle East & North Africa (excluding high income)Middle East & North Africa (IDA & IBRD countries)Middle incomeMoldovaMongoliaMontenegroMoroccoMozambiqueMyanmarNamibiaNepalNetherlandsNew CaledoniaNew ZealandNicaraguaNigerNigeriaNorth AmericaNorwayOECD membersOmanPacific island small statesPakistanPalauPanamaPapua New GuineaParaguayPeruPhilippinesPolandPortugalPost-demographic dividendPre-demographic dividendRomaniaRussian FederationRwandaSamoaSao Tome and PrincipeSaudi ArabiaSenegalSerbiaSeychellesSierra LeoneSingaporeSint Maarten (Dutch part)Slovak RepublicSloveniaSmall statesSolomon IslandsSouth AfricaSouth AsiaSouth Asia (IDA & IBRD)South SudanSpainSri LankaSt. Kitts and NevisSt. LuciaSt. Vincent and the GrenadinesSub-Saharan Africa Sub-Saharan Africa (excluding high income)Sub-Saharan Africa (IDA & IBRD countries)SudanSurinameSwazilandSwedenSwitzerlandSyrian Arab RepublicTajikistanTanzaniaThailandTogoTongaTrinidad and TobagoTunisiaTurkeyTuvaluUgandaUkraineUnited KingdomUnited StatesUpper middle incomeUruguayVanuatuVenezuela, RBWest Bank and GazaWorldYemen, Rep.ZambiaZimbabwe Timeline:
This timeline shows a graph from 1978 to 2016 of Switzerland. No data until 1977. Number of actual observations by date: 39.
Source name:
World Development Indicators
Source organization:
International Monetary Fund, Balance of Payments Statistics Yearbook and data files.
Categories, topics:
Economy & Growth, Infrastructure, Trade
Last updated:
apr 23, 2017
Indicators value changes by year
Minimum:
1.339 bln
jan 1, 1978
Maximum:
33.199 bln
jan 1, 2016
At the date of observation
Value
Absolute change
Change from previous value
jan 1, 1978
1.339 bln
+1.339 bln
0.0%
jan 1, 1979
1.745 bln
+405.859 mln
30.3%
jan 1, 1980
1.93 bln
+185.062 mln
10.6%
jan 1, 1981
2.099 bln
+168.426 mln
8.73%
jan 1, 1982
2.194 bln
+95.136 mln
4.53%
jan 1, 1983
2.354 bln
+160.52 mln
7.32%
jan 1, 1984
2.073 bln
-281.577 mln
-11.96%
jan 1, 1985
2.017 bln
-55.884 mln
-2.7%
jan 1, 1986
2.3 bln
+283.382 mln
14.05%
jan 1, 1987
3.046 bln
+745.473 mln
32.41%
jan 1, 1988
3.893 bln
+847.138 mln
27.81%
jan 1, 1989
4.237 bln
+344.139 mln
8.84%
jan 1, 1990
2.416 bln
-1.821 bln
-42.97%
jan 1, 1991
2.864 bln
+447.965 mln
18.54%
jan 1, 1992
2.902 bln
+37.852 mln
1.32%
jan 1, 1993
3.214 bln
+311.833 mln
10.74%
jan 1, 1994
3.343 bln
+128.599 mln
4.0%
jan 1, 1995
3.643 bln
+300.098 mln
8.98%
jan 1, 1996
4.025 bln
+381.851 mln
10.48%
jan 1, 1997
3.909 bln
-115.761 mln
-2.88%
jan 1, 1998
3.933 bln
+24.537 mln
0.63%
jan 1, 1999
4.272 bln
+338.662 mln
8.61%
jan 1, 2000
5.011 bln
+738.982 mln
17.3%
jan 1, 2001
8.445 bln
+3.434 bln
68.53%
jan 1, 2002
8.415 bln
-29.998 mln
-0.36%
jan 1, 2003
9.257 bln
+842.0 mln
10.01%
jan 1, 2004
10.588 bln
+1.331 bln
14.38%
jan 1, 2005
12.573 bln
+1.985 bln
18.74%
jan 1, 2006
13.099 bln
+525.476 mln
4.18%
jan 1, 2007
13.628 bln
+529.717 mln
4.04%
jan 1, 2008
15.34 bln
+1.712 bln
12.56%
jan 1, 2009
17.836 bln
+2.496 bln
16.27%
jan 1, 2010
17.999 bln
+162.45 mln
0.91%
jan 1, 2011
20.403 bln
+2.404 bln
13.36%
jan 1, 2012
24.213 bln
+3.81 bln
18.67%
jan 1, 2013
26.655 bln
+2.442 bln
10.09%
jan 1, 2014
27.622 bln
+967.935 mln
3.63%
jan 1, 2015
32.865 bln
+5.243 bln
18.98%
jan 1, 2016
33.199 bln
+334.469 mln
1.02%
Ranking of countries by current statistics by years


Comments: