29
/
en
AIzaSyAYiBZKx7MnpbEhh9jyipgxe19OcubqV5w
April 1, 2024
66114
Algeria
DZA
true
2
1
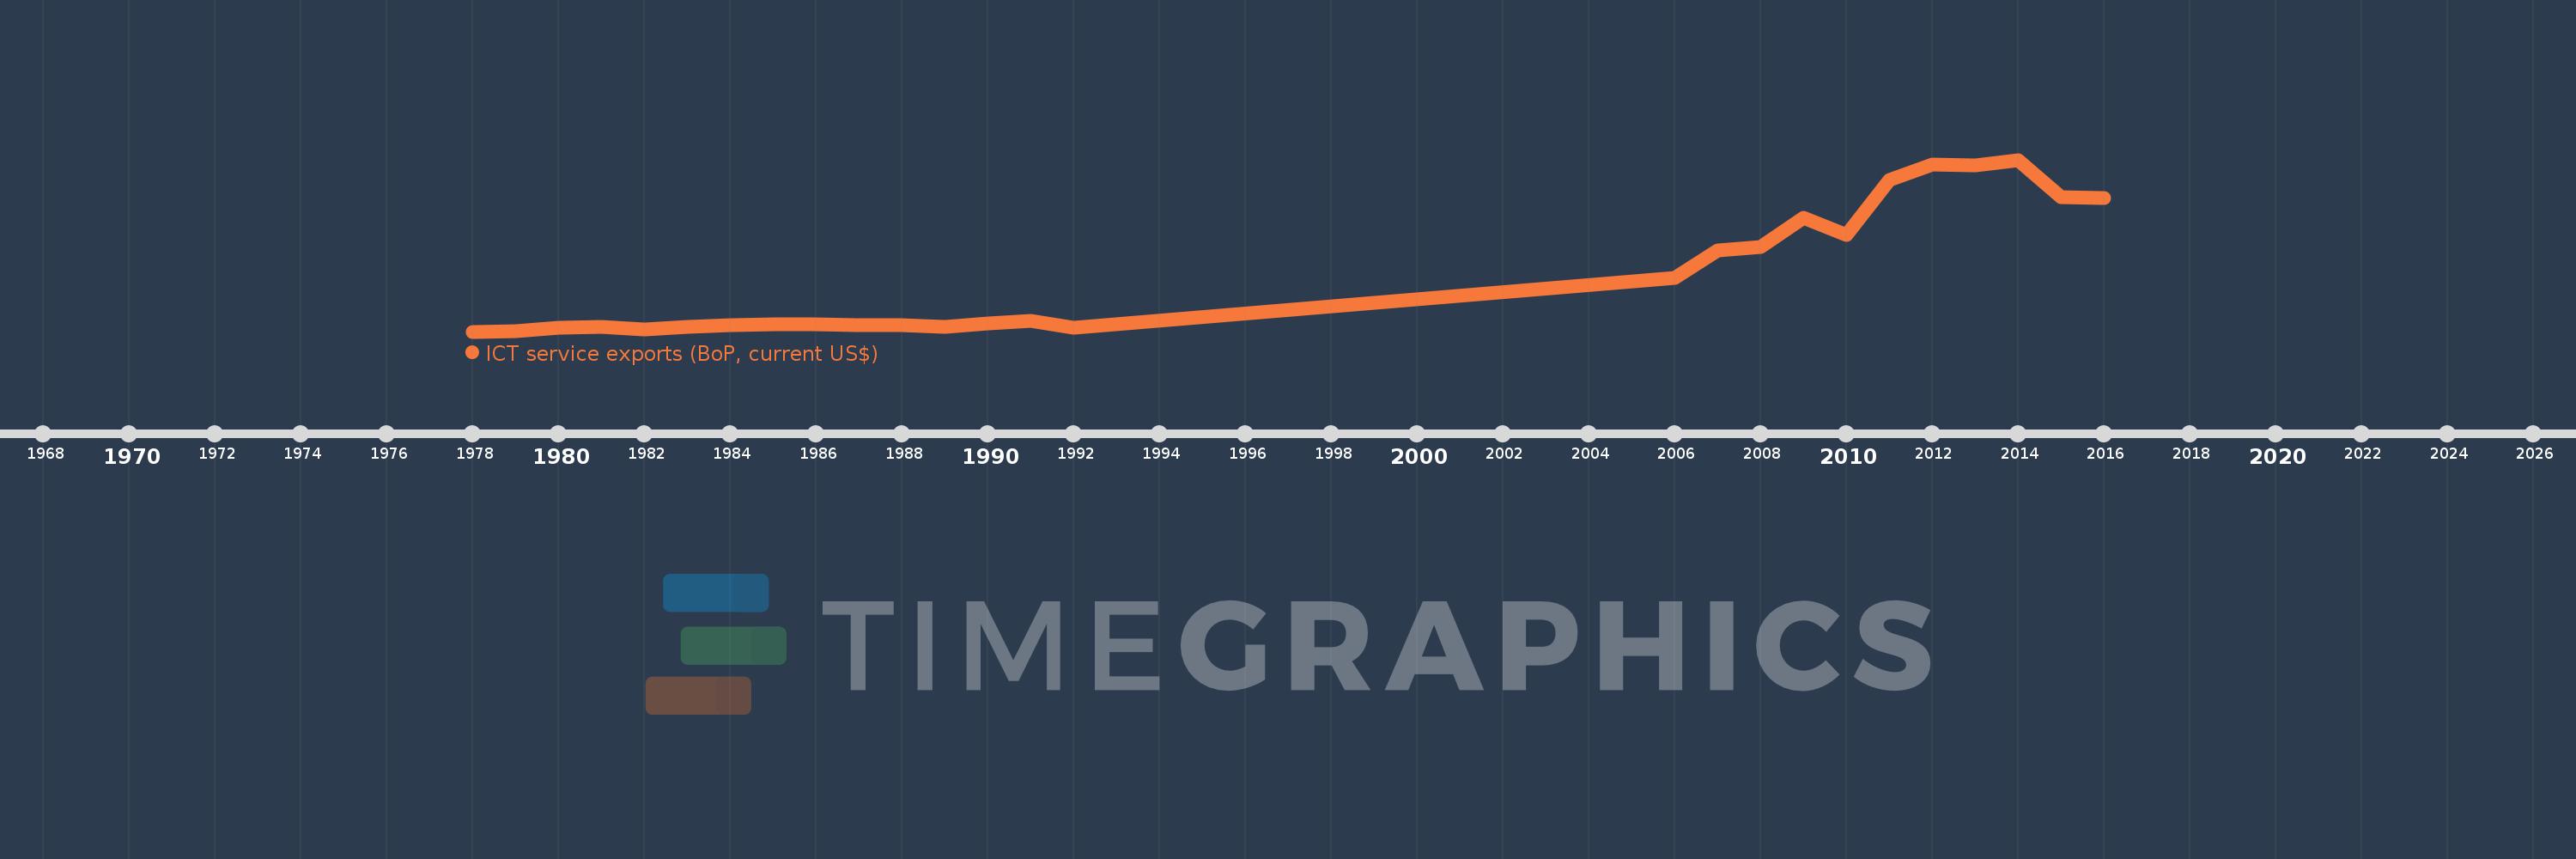
ICT service exports (BoP, current US$)
2016,2015,2014,2013,2012,2011,2010,2009,2008,2007,2006,1992,1991,1990,1989,1988,1987,1986,1985,1984,1983,1982,1981,1980,1979,1978
This statistics in other country:
AfghanistanAlbaniaAlgeriaAngolaAntigua and BarbudaArab WorldArgentinaArmeniaArubaAustraliaAustriaAzerbaijanBahrainBangladeshBarbadosBelarusBelgiumBelizeBeninBermudaBhutanBoliviaBosnia and HerzegovinaBotswanaBrazilBrunei DarussalamBulgariaBurkina FasoBurundiCabo VerdeCambodiaCameroonCanadaCaribbean small statesCentral Europe and the BalticsChileChinaColombiaComorosCongo, Dem. Rep.Congo, Rep.Costa RicaCote d'IvoireCroatiaCuracaoCyprusCzech RepublicDenmarkDjiboutiDominicaDominican RepublicEarly-demographic dividendEast Asia & PacificEast Asia & Pacific (excluding high income)East Asia & Pacific (IDA & IBRD countries)EcuadorEgypt, Arab Rep.El SalvadorEritreaEstoniaEthiopiaEuro areaEurope & Central AsiaEurope & Central Asia (excluding high income)Europe & Central Asia (IDA & IBRD countries)European UnionFaroe IslandsFijiFinlandFragile and conflict affected situationsFranceFrench PolynesiaGabonGambia, TheGeorgiaGermanyGreeceGrenadaGuatemalaGuineaGuinea-BissauGuyanaHeavily indebted poor countries (HIPC)High incomeHondurasHong Kong SAR, ChinaHungaryIBRD onlyIcelandIDA & IBRD totalIDA blendIDA onlyIDA totalIndiaIndonesiaIraqIrelandIsraelItalyJamaicaJapanJordanKazakhstanKenyaKorea, Rep.KosovoKuwaitKyrgyz RepublicLao PDRLate-demographic dividendLatin America & Caribbean Latin America & Caribbean (excluding high income)Latin America & the Caribbean (IDA & IBRD countries)LatviaLeast developed countries: UN classificationLebanonLesothoLithuaniaLow & middle incomeLow incomeLower middle incomeLuxembourgMacao SAR, ChinaMacedonia, FYRMadagascarMalawiMalaysiaMaliMaltaMauritaniaMauritiusMexicoMicronesia, Fed. Sts.Middle East & North AfricaMiddle East & North Africa (excluding high income)Middle East & North Africa (IDA & IBRD countries)Middle incomeMoldovaMongoliaMontenegroMoroccoMozambiqueMyanmarNamibiaNepalNetherlandsNew CaledoniaNew ZealandNicaraguaNigerNigeriaNorth AmericaNorwayOECD membersOmanPacific island small statesPakistanPalauPanamaPapua New GuineaParaguayPeruPhilippinesPolandPortugalPost-demographic dividendPre-demographic dividendRomaniaRussian FederationRwandaSamoaSao Tome and PrincipeSaudi ArabiaSenegalSerbiaSeychellesSierra LeoneSingaporeSint Maarten (Dutch part)Slovak RepublicSloveniaSmall statesSolomon IslandsSouth AfricaSouth AsiaSouth Asia (IDA & IBRD)South SudanSpainSri LankaSt. Kitts and NevisSt. LuciaSt. Vincent and the GrenadinesSub-Saharan Africa Sub-Saharan Africa (excluding high income)Sub-Saharan Africa (IDA & IBRD countries)SudanSurinameSwazilandSwedenSwitzerlandSyrian Arab RepublicTajikistanTanzaniaThailandTogoTongaTrinidad and TobagoTunisiaTurkeyTuvaluUgandaUkraineUnited KingdomUnited StatesUpper middle incomeUruguayVanuatuVenezuela, RBWest Bank and GazaWorldYemen, Rep.ZambiaZimbabwe Timeline:
This timeline shows a graph from 1978 to 2016 of Algeria. No data until 1977. Number of actual observations by date: 26.
Source name:
World Development Indicators
Source organization:
International Monetary Fund, Balance of Payments Statistics Yearbook and data files.
Categories, topics:
Economy & Growth, Infrastructure, Trade
Last updated:
apr 23, 2017
Indicators value changes by year
Minimum:
49.677 mln
jan 1, 1978
Maximum:
2.235 bln
jan 1, 2014
At the date of observation
Value
Absolute change
Change from previous value
jan 1, 1978
49.677 mln
+49.677 mln
0.0%
jan 1, 1979
56.229 mln
+6.552 mln
13.19%
jan 1, 1980
102.251 mln
+46.022 mln
81.85%
jan 1, 1981
110.49 mln
+8.239 mln
8.06%
jan 1, 1982
73.914 mln
-36.576 mln
-33.1%
jan 1, 1983
111.711 mln
+37.797 mln
51.14%
jan 1, 1984
129.886 mln
+18.175 mln
16.27%
jan 1, 1985
138.862 mln
+8.975 mln
6.91%
jan 1, 1986
144.994 mln
+6.132 mln
4.42%
jan 1, 1987
129.723 mln
-15.271 mln
-10.53%
jan 1, 1988
136.502 mln
+6.779 mln
5.23%
jan 1, 1989
112.261 mln
-24.241 mln
-17.76%
jan 1, 1990
157.98 mln
+45.719 mln
40.73%
jan 1, 1991
186.659 mln
+28.679 mln
18.15%
jan 1, 1992
100.526 mln
-86.133 mln
-46.14%
jan 1, 2006
733.0 mln
+632.474 mln
629.17%
jan 1, 2007
1.078 bln
+345.0 mln
47.07%
jan 1, 2008
1.122 bln
+43.753 mln
4.06%
jan 1, 2009
1.497 bln
+375.493 mln
33.47%
jan 1, 2010
1.283 bln
-214.52 mln
-14.33%
jan 1, 2011
1.977 bln
+694.098 mln
54.11%
jan 1, 2012
2.172 bln
+195.314 mln
9.88%
jan 1, 2013
2.169 bln
-2.915 mln
-0.13%
jan 1, 2014
2.235 bln
+65.653 mln
3.03%
jan 1, 2015
1.757 bln
-478.338 mln
-21.4%
jan 1, 2016
1.751 bln
-6.028 mln
-0.34%
Ranking of countries by current statistics by years


Comments: