29
/
en
AIzaSyAYiBZKx7MnpbEhh9jyipgxe19OcubqV5w
April 1, 2024
114915
Croatia
HRV
true
2
1
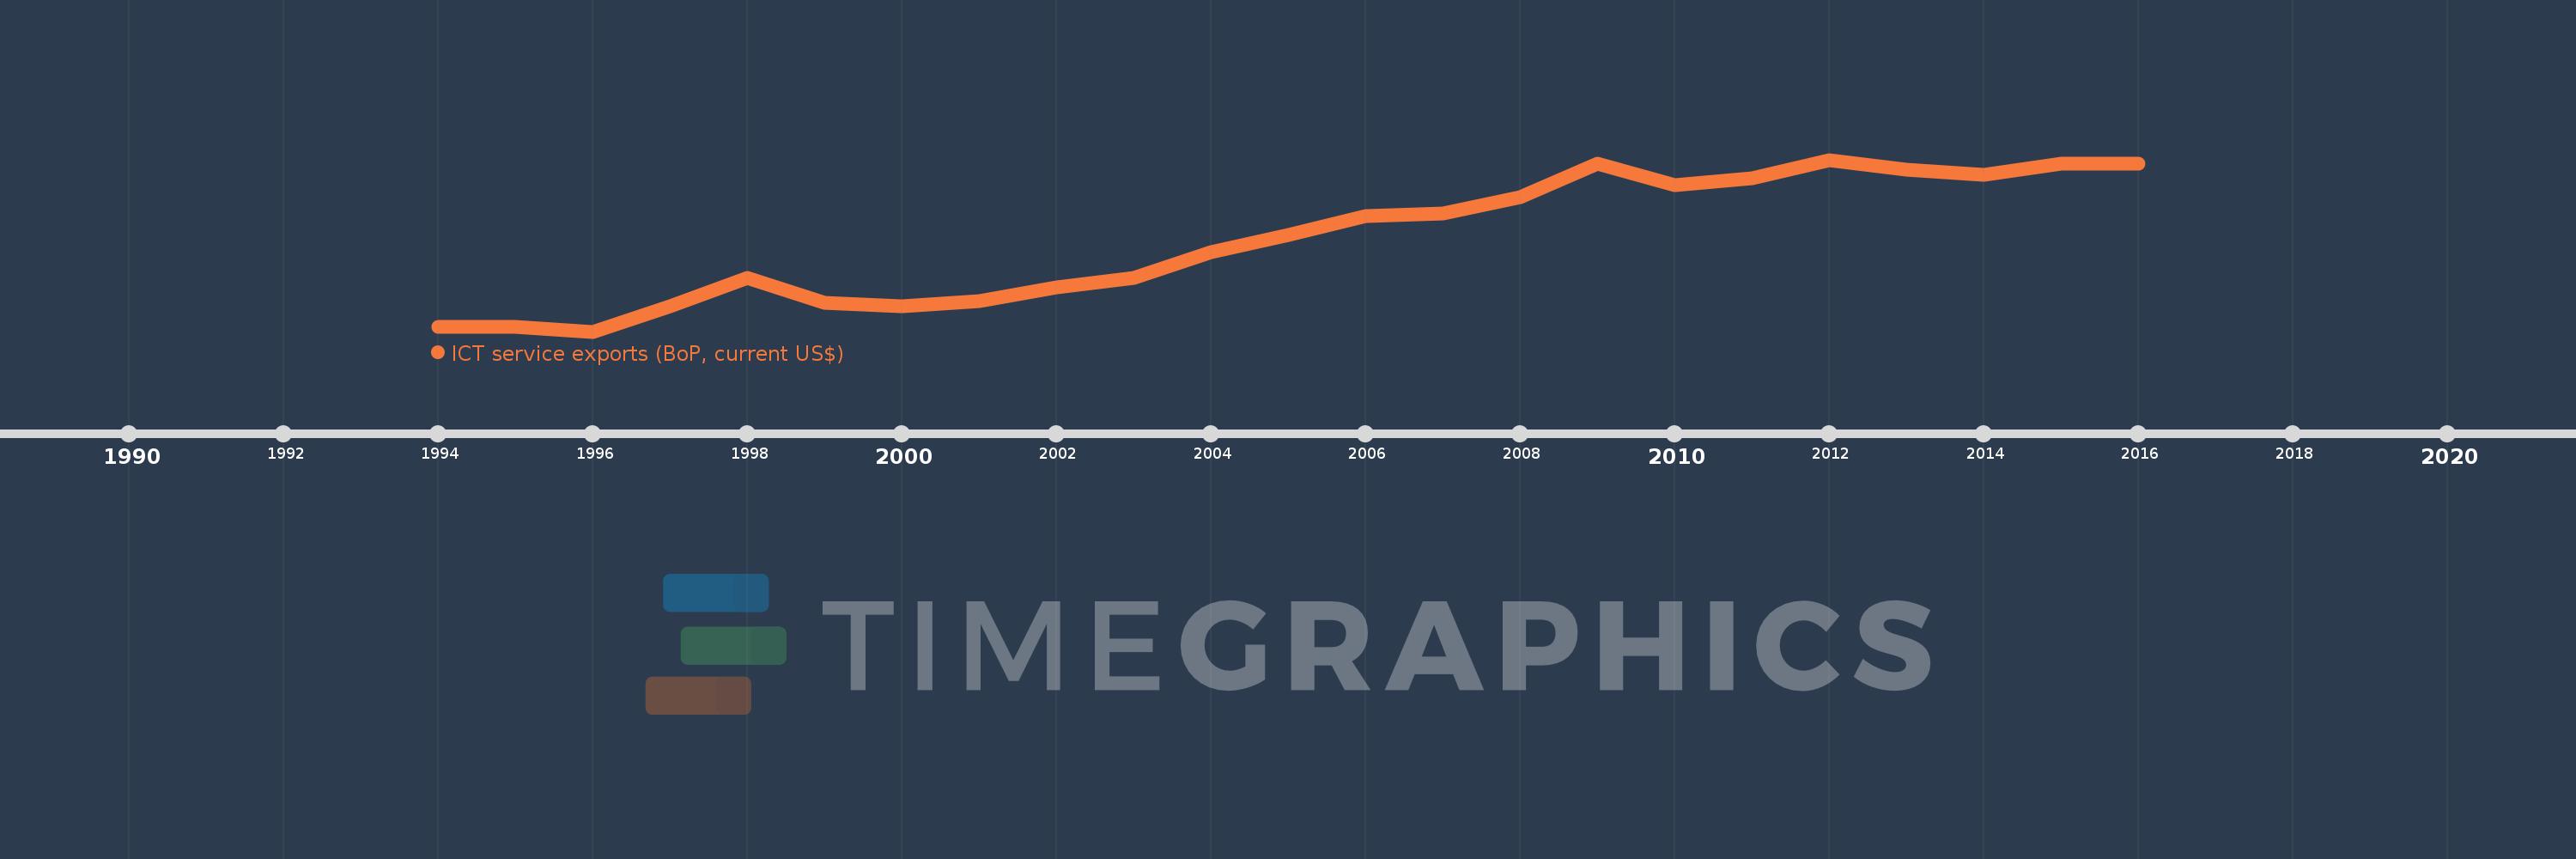
ICT service exports (BoP, current US$)
2016,2015,2014,2013,2012,2011,2010,2009,2008,2007,2006,2005,2004,2003,2002,2001,2000,1999,1998,1997,1996,1995,1994
This statistics in other country:
AfghanistanAlbaniaAlgeriaAngolaAntigua and BarbudaArab WorldArgentinaArmeniaArubaAustraliaAustriaAzerbaijanBahrainBangladeshBarbadosBelarusBelgiumBelizeBeninBermudaBhutanBoliviaBosnia and HerzegovinaBotswanaBrazilBrunei DarussalamBulgariaBurkina FasoBurundiCabo VerdeCambodiaCameroonCanadaCaribbean small statesCentral Europe and the BalticsChileChinaColombiaComorosCongo, Dem. Rep.Congo, Rep.Costa RicaCote d'IvoireCroatiaCuracaoCyprusCzech RepublicDenmarkDjiboutiDominicaDominican RepublicEarly-demographic dividendEast Asia & PacificEast Asia & Pacific (excluding high income)East Asia & Pacific (IDA & IBRD countries)EcuadorEgypt, Arab Rep.El SalvadorEritreaEstoniaEthiopiaEuro areaEurope & Central AsiaEurope & Central Asia (excluding high income)Europe & Central Asia (IDA & IBRD countries)European UnionFaroe IslandsFijiFinlandFragile and conflict affected situationsFranceFrench PolynesiaGabonGambia, TheGeorgiaGermanyGreeceGrenadaGuatemalaGuineaGuinea-BissauGuyanaHeavily indebted poor countries (HIPC)High incomeHondurasHong Kong SAR, ChinaHungaryIBRD onlyIcelandIDA & IBRD totalIDA blendIDA onlyIDA totalIndiaIndonesiaIraqIrelandIsraelItalyJamaicaJapanJordanKazakhstanKenyaKorea, Rep.KosovoKuwaitKyrgyz RepublicLao PDRLate-demographic dividendLatin America & Caribbean Latin America & Caribbean (excluding high income)Latin America & the Caribbean (IDA & IBRD countries)LatviaLeast developed countries: UN classificationLebanonLesothoLithuaniaLow & middle incomeLow incomeLower middle incomeLuxembourgMacao SAR, ChinaMacedonia, FYRMadagascarMalawiMalaysiaMaliMaltaMauritaniaMauritiusMexicoMicronesia, Fed. Sts.Middle East & North AfricaMiddle East & North Africa (excluding high income)Middle East & North Africa (IDA & IBRD countries)Middle incomeMoldovaMongoliaMontenegroMoroccoMozambiqueMyanmarNamibiaNepalNetherlandsNew CaledoniaNew ZealandNicaraguaNigerNigeriaNorth AmericaNorwayOECD membersOmanPacific island small statesPakistanPalauPanamaPapua New GuineaParaguayPeruPhilippinesPolandPortugalPost-demographic dividendPre-demographic dividendRomaniaRussian FederationRwandaSamoaSao Tome and PrincipeSaudi ArabiaSenegalSerbiaSeychellesSierra LeoneSingaporeSint Maarten (Dutch part)Slovak RepublicSloveniaSmall statesSolomon IslandsSouth AfricaSouth AsiaSouth Asia (IDA & IBRD)South SudanSpainSri LankaSt. Kitts and NevisSt. LuciaSt. Vincent and the GrenadinesSub-Saharan Africa Sub-Saharan Africa (excluding high income)Sub-Saharan Africa (IDA & IBRD countries)SudanSurinameSwazilandSwedenSwitzerlandSyrian Arab RepublicTajikistanTanzaniaThailandTogoTongaTrinidad and TobagoTunisiaTurkeyTuvaluUgandaUkraineUnited KingdomUnited StatesUpper middle incomeUruguayVanuatuVenezuela, RBWest Bank and GazaWorldYemen, Rep.ZambiaZimbabwe Timeline:
This timeline shows a graph from 1994 to 2016 of Croatia. No data until 1993. Number of actual observations by date: 23.
Source name:
World Development Indicators
Source organization:
International Monetary Fund, Balance of Payments Statistics Yearbook and data files.
Categories, topics:
Economy & Growth, Infrastructure, Trade
Last updated:
apr 23, 2017
Indicators value changes by year
Minimum:
106.951 mln
jan 1, 1996
Maximum:
1.66 bln
jan 1, 2012
At the date of observation
Value
Absolute change
Change from previous value
jan 1, 1994
150.93 mln
+150.93 mln
0.0%
jan 1, 1995
153.025 mln
+2.095 mln
1.39%
jan 1, 1996
106.951 mln
-46.074 mln
-30.11%
jan 1, 1997
333.276 mln
+226.325 mln
211.62%
jan 1, 1998
588.823 mln
+255.547 mln
76.68%
jan 1, 1999
369.136 mln
-219.687 mln
-37.31%
jan 1, 2000
336.74 mln
-32.396 mln
-8.78%
jan 1, 2001
383.873 mln
+47.133 mln
14.0%
jan 1, 2002
503.194 mln
+119.321 mln
31.08%
jan 1, 2003
591.341 mln
+88.147 mln
17.52%
jan 1, 2004
828.438 mln
+237.097 mln
40.09%
jan 1, 2005
981.162 mln
+152.724 mln
18.44%
jan 1, 2006
1.154 bln
+172.947 mln
17.63%
jan 1, 2007
1.173 bln
+19.152 mln
1.66%
jan 1, 2008
1.321 bln
+147.513 mln
12.57%
jan 1, 2009
1.624 bln
+303.264 mln
22.96%
jan 1, 2010
1.43 bln
-193.829 mln
-11.93%
jan 1, 2011
1.495 bln
+64.432 mln
4.51%
jan 1, 2012
1.66 bln
+165.745 mln
11.09%
jan 1, 2013
1.57 bln
-90.419 mln
-5.45%
jan 1, 2014
1.522 bln
-48.319 mln
-3.08%
jan 1, 2015
1.629 bln
+107.42 mln
7.06%
jan 1, 2016
1.625 bln
-4.42 mln
-0.27%
Ranking of countries by current statistics by years


Comments: