29
/
en
AIzaSyAYiBZKx7MnpbEhh9jyipgxe19OcubqV5w
April 1, 2024
25630
Central Europe and the Baltics
CEB
false
2
1
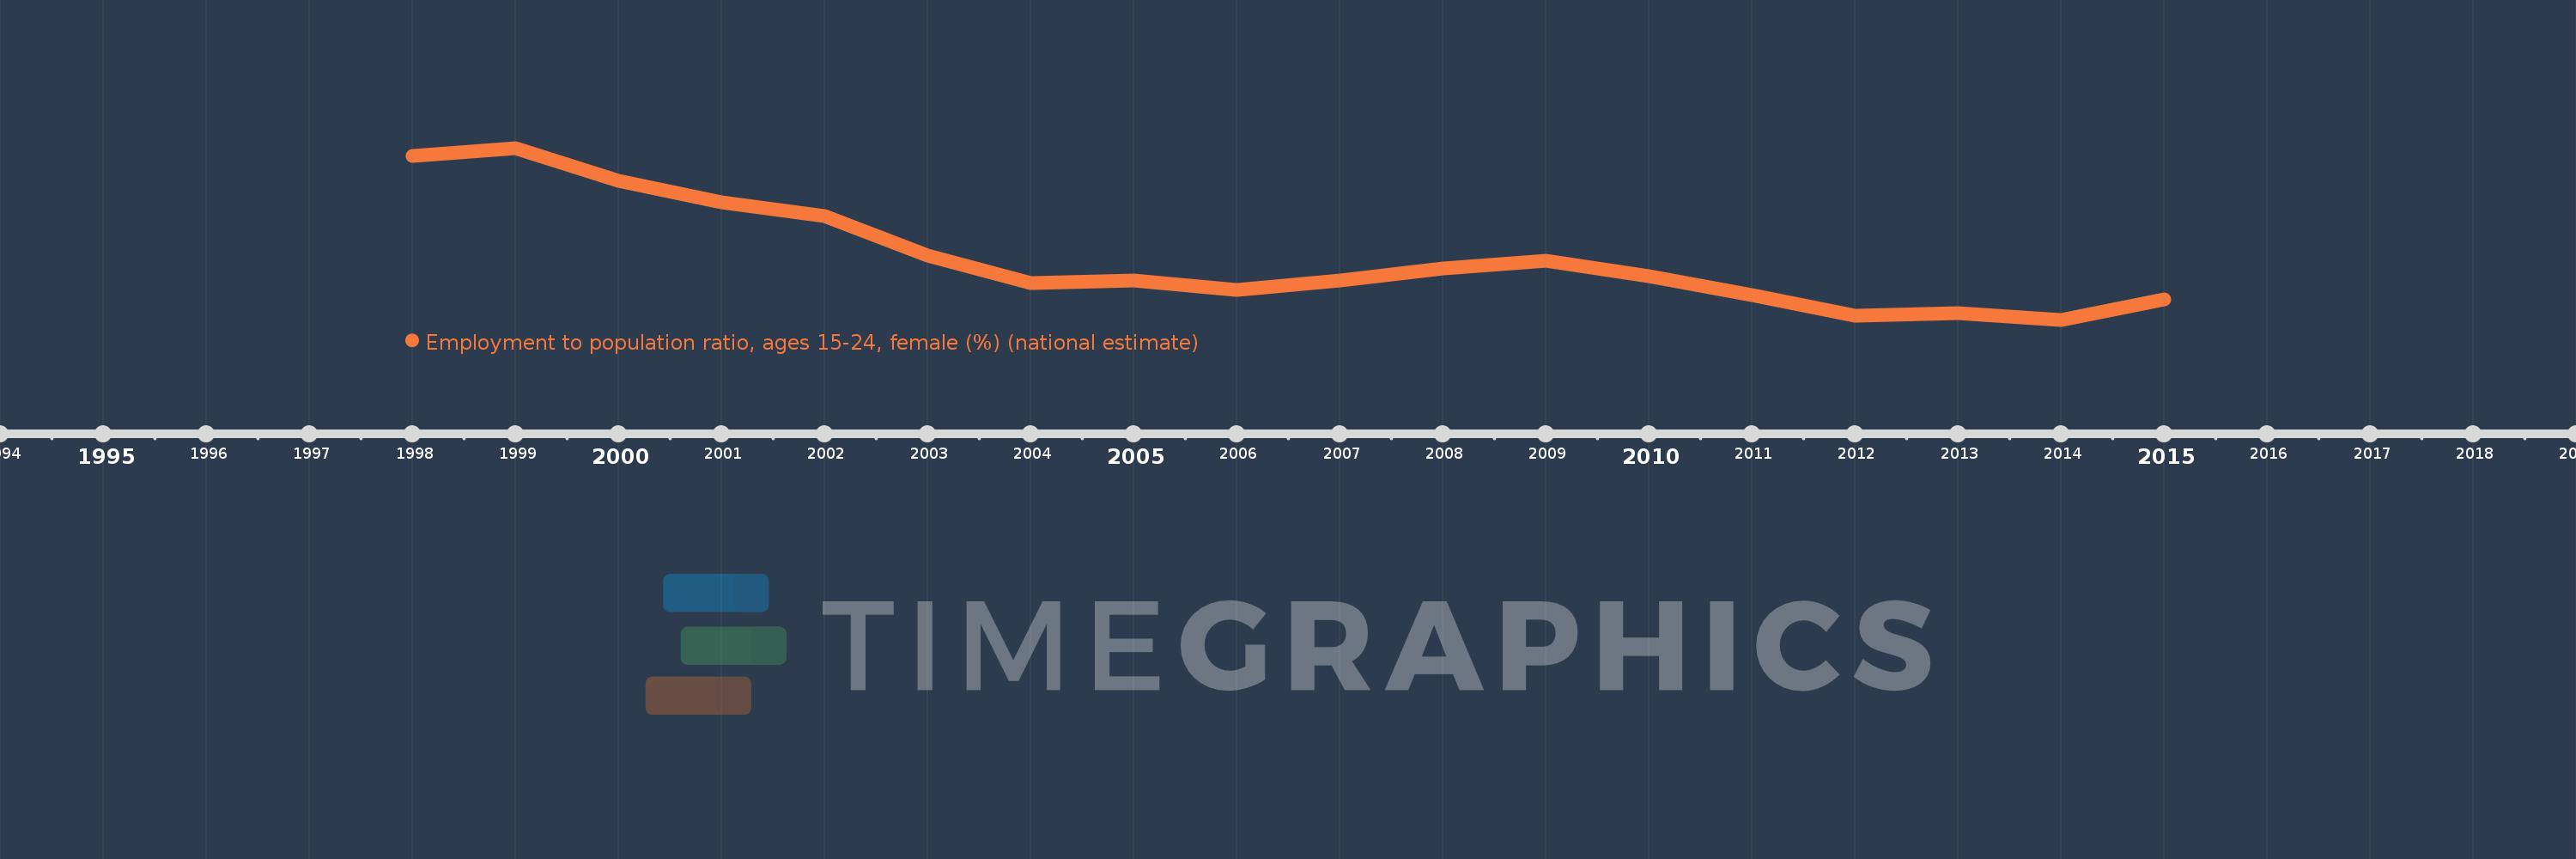
Employment to population ratio, ages 15-24, female (%) (national estimate)
2015,2014,2013,2012,2011,2010,2009,2008,2007,2006,2005,2004,2003,2002,2001,2000,1999,1998
This statistics in other country:
Timeline:
This timeline shows a graph from 1998 to 2015 of Central Europe and the Baltics. No data until 1997. Number of actual observations by date: 18.
Source name:
World Development Indicators
Source organization:
International Labour Organization, Key Indicators of the Labour Market database.
Categories, topics:
Social Protection & Labor
Last updated:
apr 23, 2017
Indicators value changes by year
Minimum:
19.112
jan 1, 2014
Maximum:
29.203
jan 1, 1999
At the date of observation
Value
Absolute change
Change from previous value
jan 1, 1998
28.734
+28.734
0.0%
jan 1, 1999
29.203
+0.469
1.63%
jan 1, 2000
27.29
-1.913
-6.55%
jan 1, 2001
26.015
-1.275
-4.67%
jan 1, 2002
25.22
-0.796
-3.06%
jan 1, 2003
22.885
-2.335
-9.26%
jan 1, 2004
21.281
-1.604
-7.01%
jan 1, 2005
21.404
+0.124
0.58%
jan 1, 2006
20.865
-0.539
-2.52%
jan 1, 2007
21.437
+0.572
2.74%
jan 1, 2008
22.134
+0.696
3.25%
jan 1, 2009
22.587
+0.453
2.05%
jan 1, 2010
21.655
-0.931
-4.12%
jan 1, 2011
20.573
-1.082
-5.0%
jan 1, 2012
19.326
-1.247
-6.06%
jan 1, 2013
19.487
+0.16
0.83%
jan 1, 2014
19.112
-0.375
-1.92%
jan 1, 2015
20.305
+1.193
6.24%
Ranking of countries by current statistics by years


Comments: