29
/
en
AIzaSyAYiBZKx7MnpbEhh9jyipgxe19OcubqV5w
April 1, 2024
54715
Post-demographic dividend
PST
false
2
1
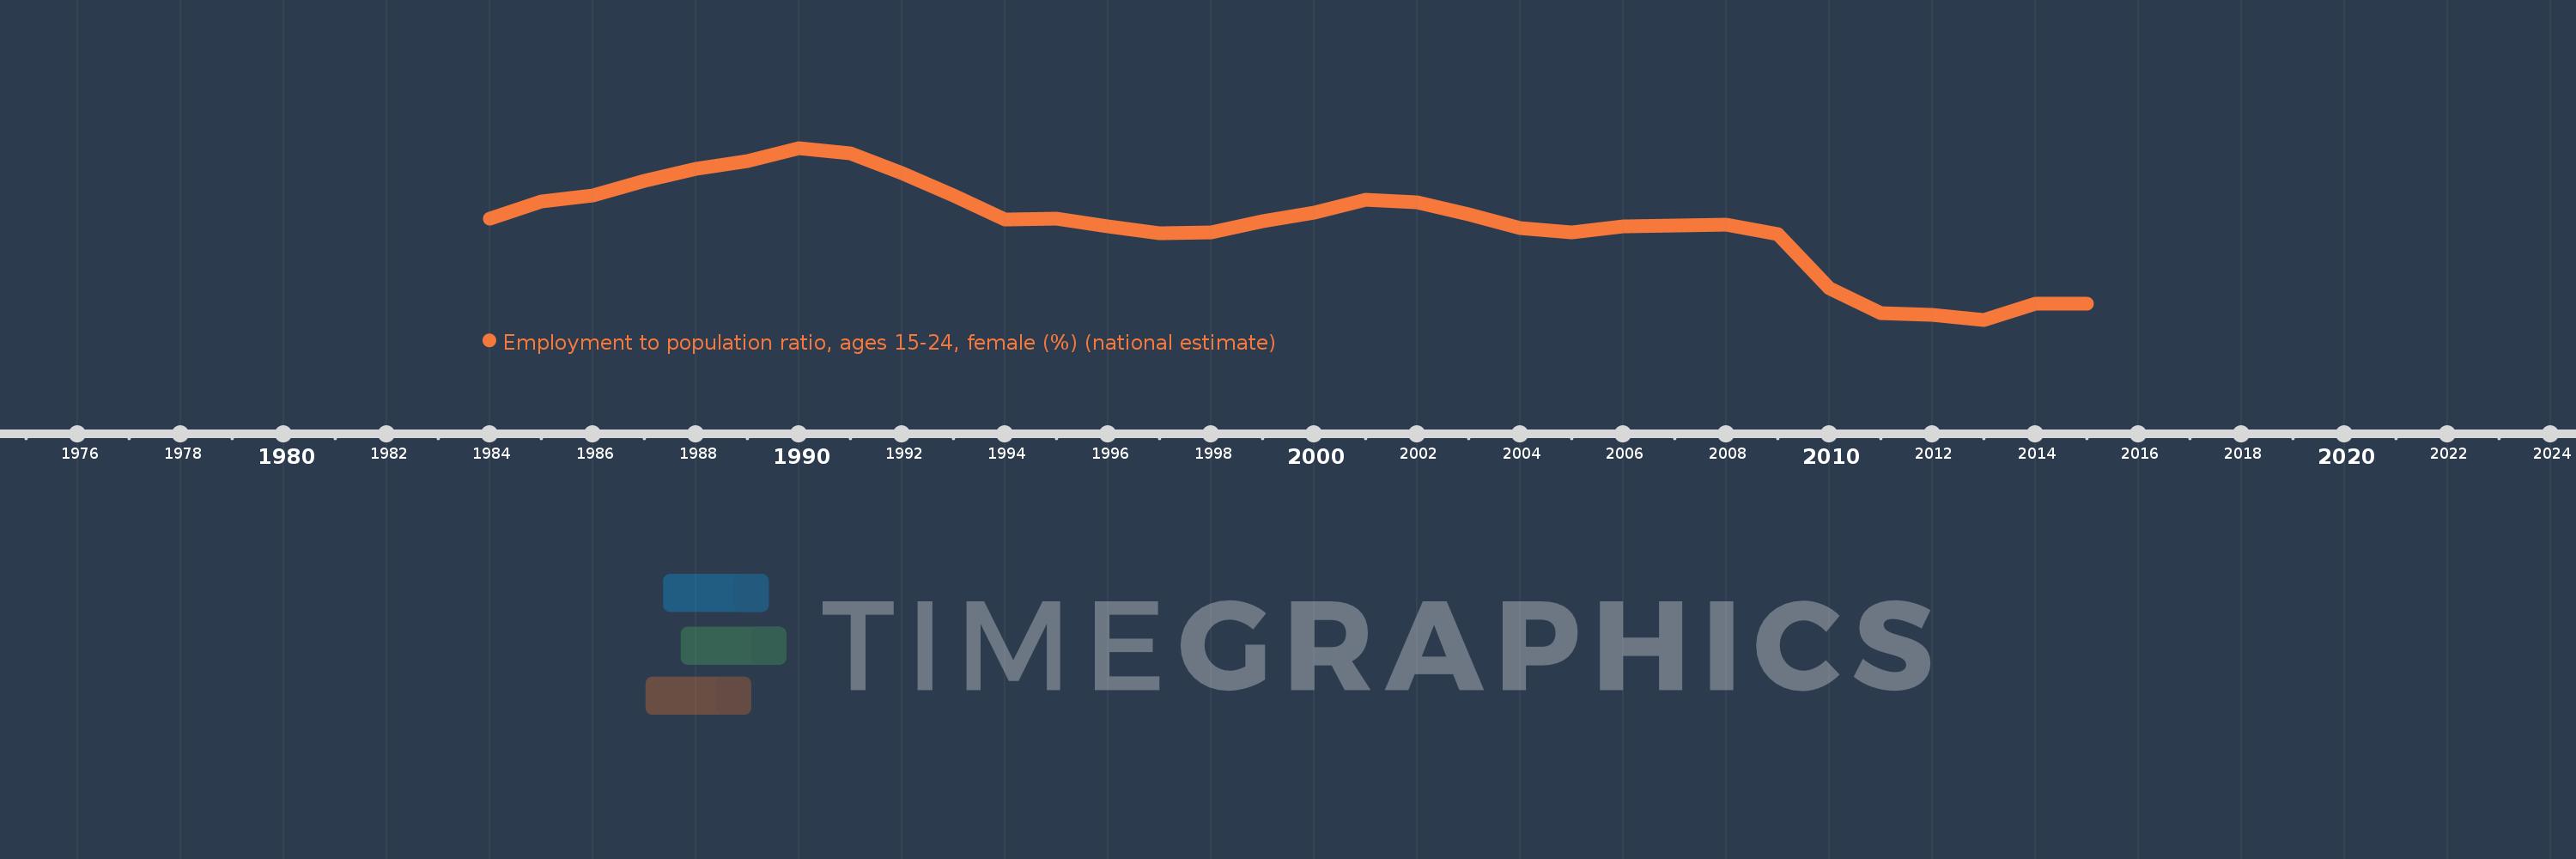
Employment to population ratio, ages 15-24, female (%) (national estimate)
2015,2014,2013,2012,2011,2010,2009,2008,2007,2006,2005,2004,2003,2002,2001,2000,1999,1998,1997,1996,1995,1994,1993,1992,1991,1990,1989,1988,1987,1986,1985,1984
This statistics in other country:
Timeline:
This timeline shows a graph from 1984 to 2015 of Post-demographic dividend. No data until 1983. Number of actual observations by date: 32.
Source name:
World Development Indicators
Source organization:
International Labour Organization, Key Indicators of the Labour Market database.
Categories, topics:
Social Protection & Labor
Last updated:
apr 23, 2017
Indicators value changes by year
Minimum:
39.068
jan 1, 2013
Maximum:
47.579
jan 1, 1990
At the date of observation
Value
Absolute change
Change from previous value
jan 1, 1984
44.057
+44.057
0.0%
jan 1, 1985
44.923
+0.866
1.97%
jan 1, 1986
45.22
+0.297
0.66%
jan 1, 1987
45.928
+0.708
1.57%
jan 1, 1988
46.537
+0.608
1.32%
jan 1, 1989
46.923
+0.386
0.83%
jan 1, 1990
47.579
+0.656
1.4%
jan 1, 1991
47.308
-0.271
-0.57%
jan 1, 1992
46.32
-0.988
-2.09%
jan 1, 1993
45.226
-1.094
-2.36%
jan 1, 1994
44.039
-1.187
-2.62%
jan 1, 1995
44.073
+0.034
0.08%
jan 1, 1996
43.682
-0.392
-0.89%
jan 1, 1997
43.338
-0.344
-0.79%
jan 1, 1998
43.411
+0.073
0.17%
jan 1, 1999
43.964
+0.553
1.27%
jan 1, 2000
44.383
+0.419
0.95%
jan 1, 2001
45.008
+0.625
1.41%
jan 1, 2002
44.874
-0.134
-0.3%
jan 1, 2003
44.271
-0.603
-1.34%
jan 1, 2004
43.615
-0.656
-1.48%
jan 1, 2005
43.392
-0.223
-0.51%
jan 1, 2006
43.689
+0.297
0.68%
jan 1, 2007
43.757
+0.068
0.16%
jan 1, 2008
43.778
+0.021
0.05%
jan 1, 2009
43.321
-0.457
-1.04%
jan 1, 2010
40.614
-2.707
-6.25%
jan 1, 2011
39.402
-1.213
-2.99%
jan 1, 2012
39.32
-0.082
-0.21%
jan 1, 2013
39.068
-0.252
-0.64%
jan 1, 2014
39.871
+0.804
2.06%
jan 1, 2015
39.865
-0.006
-0.01%
Ranking of countries by current statistics by years


Comments: