29
/
en
AIzaSyAYiBZKx7MnpbEhh9jyipgxe19OcubqV5w
April 1, 2024
207860
Netherlands
NLD
true
2
1
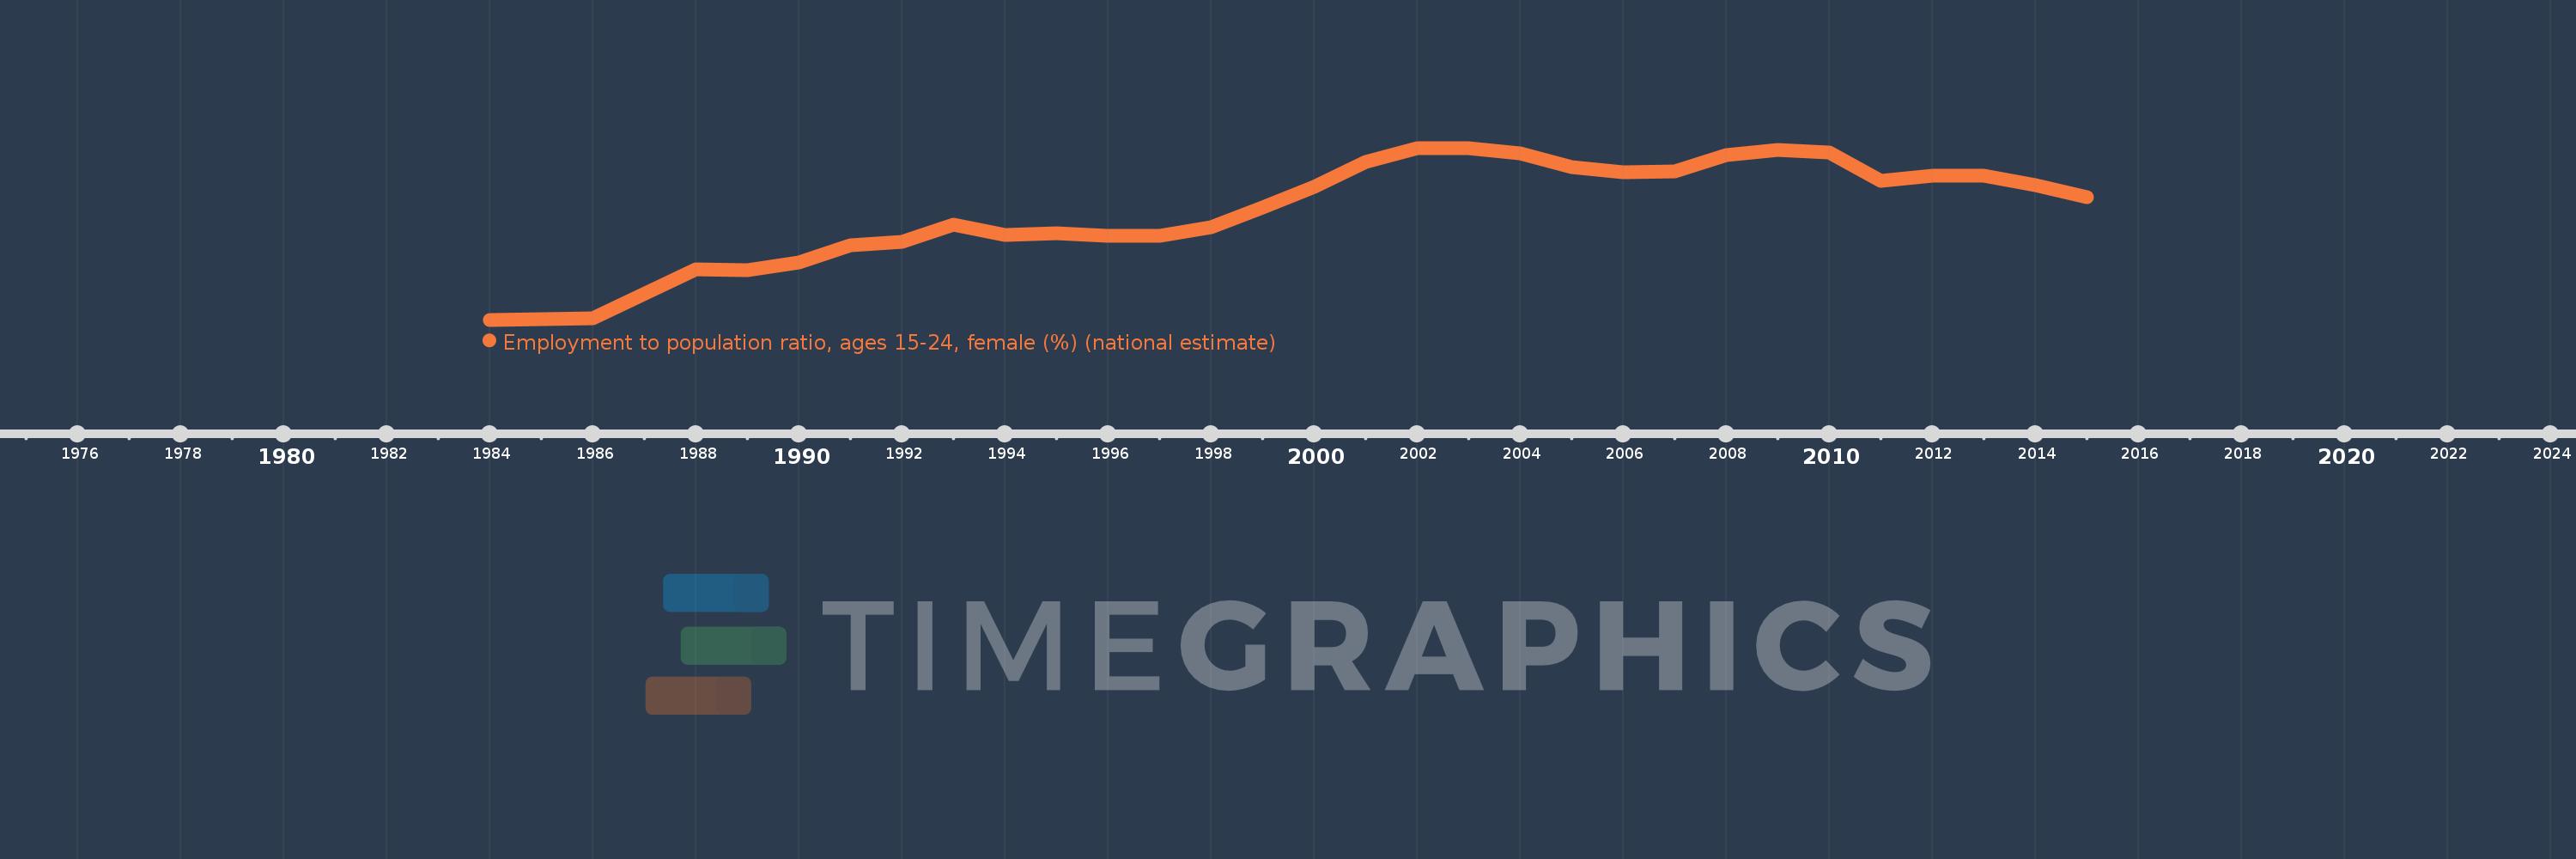
Employment to population ratio, ages 15-24, female (%) (national estimate)
2015,2014,2013,2012,2011,2010,2009,2008,2007,2006,2005,2004,2003,2002,2001,2000,1999,1998,1997,1996,1995,1994,1993,1992,1991,1990,1989,1988,1986,1984
This statistics in other country:
Timeline:
This timeline shows a graph from 1984 to 2015 of Netherlands. No data until 1983. Number of actual observations by date: 30.
Source name:
World Development Indicators
Source organization:
International Labour Organization, Key Indicators of the Labour Market database.
Categories, topics:
Social Protection & Labor
Last updated:
apr 23, 2017
Indicators value changes by year
At the date of observation
Value
Absolute change
Change from previous value
jan 1, 1984
39.3
+39.3
0.0%
jan 1, 1986
39.6
+0.3
0.76%
jan 1, 1988
48.1
+8.5
21.46%
jan 1, 1989
48.0
-0.1
-0.21%
jan 1, 1990
49.3
+1.3
2.71%
jan 1, 1991
52.2
+2.9
5.88%
jan 1, 1992
52.9
+0.7
1.34%
jan 1, 1993
55.9
+3.0
5.67%
jan 1, 1994
54.0
-1.9
-3.4%
jan 1, 1995
54.3
+0.3
0.56%
jan 1, 1996
53.9
-0.4
-0.74%
jan 1, 1998
55.4
+1.5
2.78%
jan 1, 1999
58.9
+3.5
6.32%
jan 1, 2000
62.5
+3.6
6.11%
jan 1, 2001
66.7
+4.2
6.72%
jan 1, 2002
69.2
+2.5
3.75%
jan 1, 2004
68.3
-0.9
-1.3%
jan 1, 2005
65.9
-2.4
-3.51%
jan 1, 2006
64.9
-1.0
-1.52%
jan 1, 2007
65.1
+0.2
0.31%
jan 1, 2008
67.9
+2.8
4.3%
jan 1, 2009
68.8
+0.9
1.33%
jan 1, 2010
68.4
-0.4
-0.58%
jan 1, 2011
63.5
-4.9
-7.16%
jan 1, 2012
64.4
+0.9
1.42%
jan 1, 2013
64.3
-0.1
-0.16%
jan 1, 2014
62.8
-1.5
-2.33%
jan 1, 2015
60.7
-2.1
-3.34%
Ranking of countries by current statistics by years


Comments: