29
/
en
AIzaSyAYiBZKx7MnpbEhh9jyipgxe19OcubqV5w
April 1, 2024
25171
Caribbean small states
CSS
false
2
1
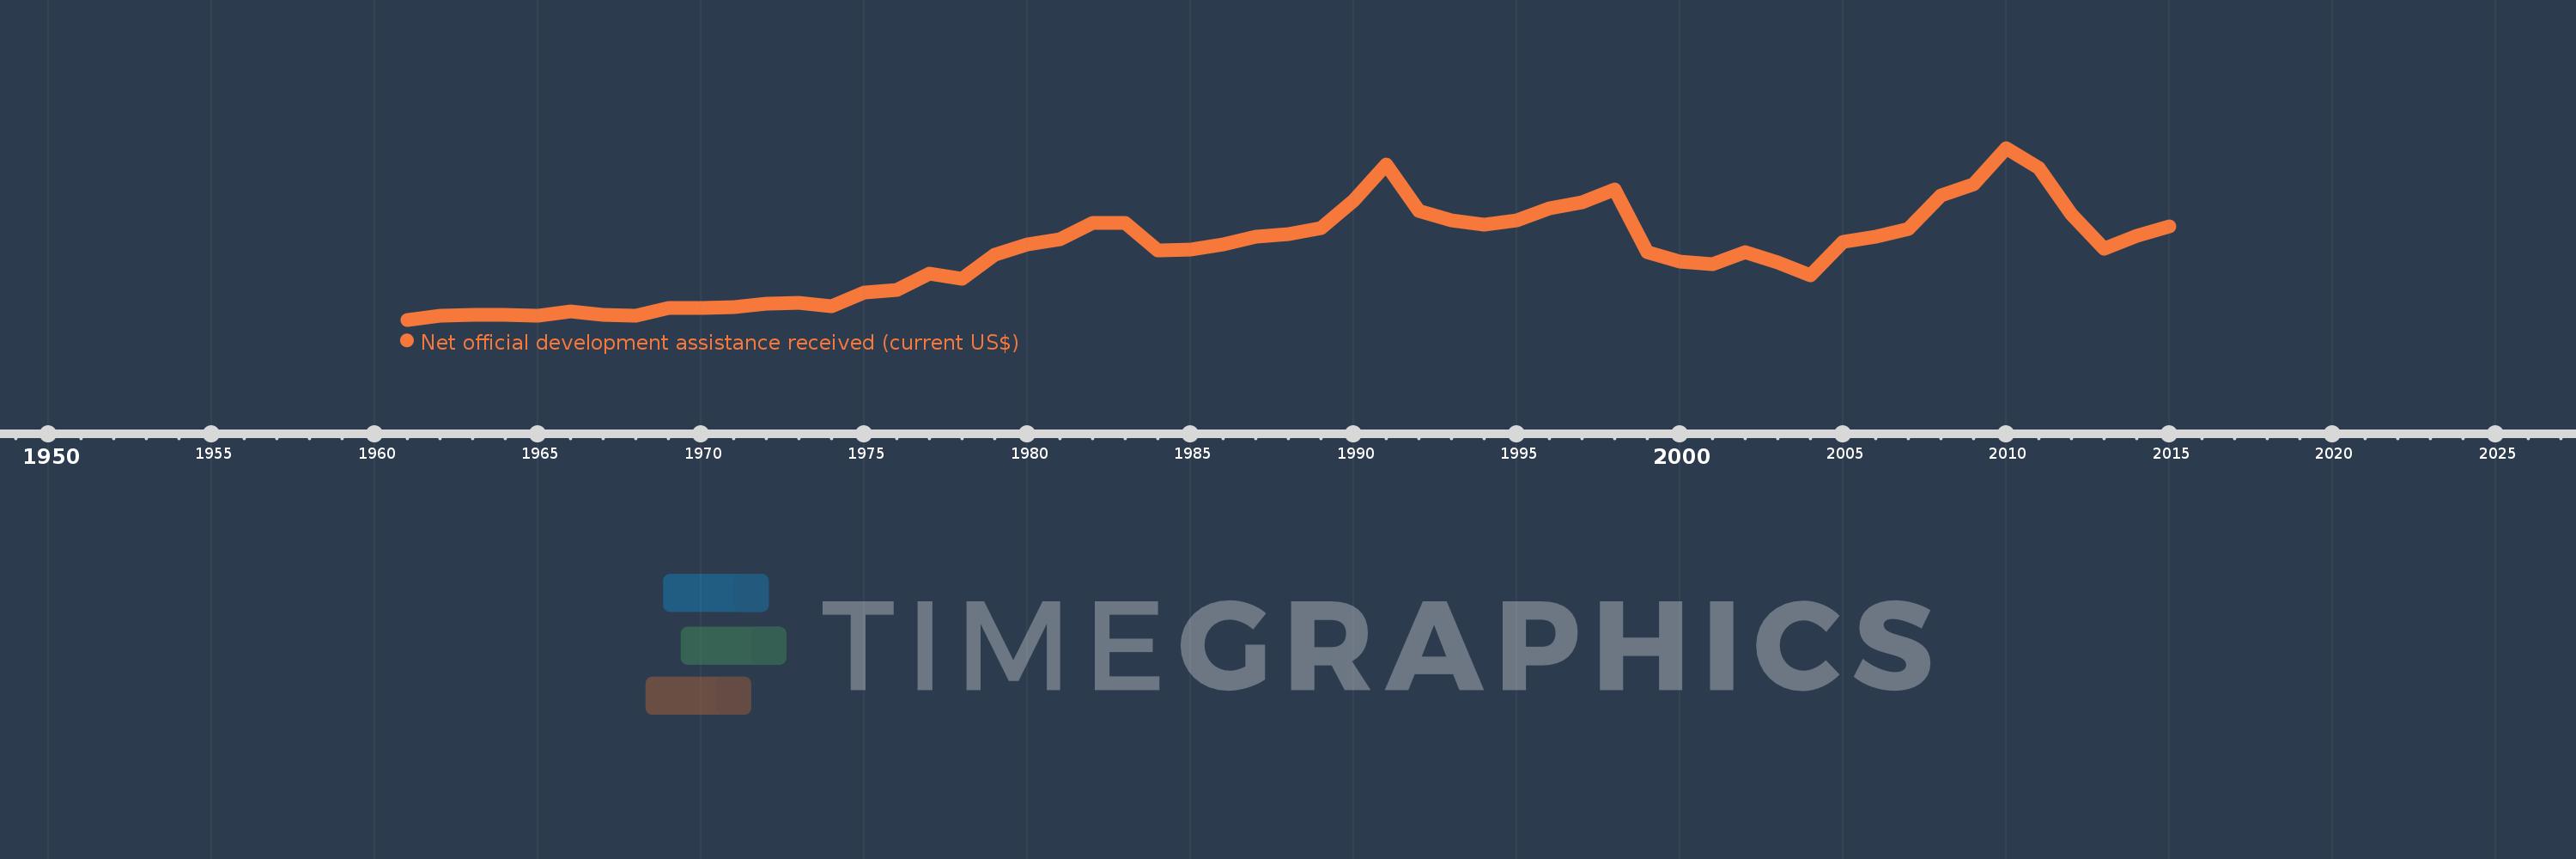
Net official development assistance received (current US$)
2015,2014,2013,2012,2011,2010,2009,2008,2007,2006,2005,2004,2003,2002,2001,2000,1999,1998,1997,1996,1995,1994,1993,1992,1991,1990,1989,1988,1987,1986,1985,1984,1983,1982,1981,1980,1979,1978,1977,1976,1975,1974,1973,1972,1971,1970,1969,1968,1967,1966,1965,1964,1963,1962,1961
This statistics in other country:
AfghanistanAlbaniaAlgeriaAngolaAntigua and BarbudaArab WorldArgentinaArmeniaArubaAzerbaijanBahamas, TheBahrainBangladeshBarbadosBelarusBelizeBeninBermudaBhutanBoliviaBosnia and HerzegovinaBotswanaBrazilBritish Virgin IslandsBrunei DarussalamBurkina FasoBurundiCabo VerdeCambodiaCameroonCaribbean small statesCayman IslandsCentral African RepublicCentral Europe and the BalticsChadChileChinaColombiaComorosCongo, Dem. Rep.Congo, Rep.Costa RicaCote d'IvoireCroatiaCubaCyprusDjiboutiDominicaDominican RepublicEast Asia & PacificEast Asia & Pacific (excluding high income)East Asia & Pacific (IDA & IBRD countries)EcuadorEgypt, Arab Rep.El SalvadorEquatorial GuineaEritreaEthiopiaEuro areaEurope & Central AsiaEurope & Central Asia (excluding high income)Europe & Central Asia (IDA & IBRD countries)European UnionFijiFragile and conflict affected situationsFrench PolynesiaGabonGambia, TheGeorgiaGhanaGibraltarGrenadaGuatemalaGuineaGuinea-BissauGuyanaHaitiHeavily indebted poor countries (HIPC)High incomeHondurasHong Kong SAR, ChinaIBRD onlyIDA & IBRD totalIDA blendIDA onlyIDA totalIndiaIndonesiaIran, Islamic Rep.IraqIsraelJamaicaJordanKazakhstanKenyaKiribatiKorea, Dem. People’s Rep.Korea, Rep.KosovoKuwaitKyrgyz RepublicLao PDRLatin America & Caribbean Latin America & Caribbean (excluding high income)Latin America & the Caribbean (IDA & IBRD countries)Least developed countries: UN classificationLebanonLesothoLiberiaLibyaLow & middle incomeLow incomeLower middle incomeMacao SAR, ChinaMacedonia, FYRMadagascarMalawiMalaysiaMaldivesMaliMaltaMarshall IslandsMauritaniaMauritiusMexicoMicronesia, Fed. Sts.Middle East & North AfricaMiddle East & North Africa (excluding high income)Middle East & North Africa (IDA & IBRD countries)Middle incomeMoldovaMongoliaMontenegroMoroccoMozambiqueMyanmarNamibiaNauruNepalNew CaledoniaNicaraguaNigerNigeriaNorth AmericaNorthern Mariana IslandsOECD membersOmanOther small statesPacific island small statesPakistanPalauPanamaPapua New GuineaParaguayPeruPhilippinesQatarRwandaSamoaSao Tome and PrincipeSaudi ArabiaSenegalSerbiaSeychellesSierra LeoneSingaporeSloveniaSmall statesSolomon IslandsSomaliaSouth AfricaSouth AsiaSouth Asia (IDA & IBRD)South SudanSri LankaSt. Kitts and NevisSt. LuciaSt. Vincent and the GrenadinesSub-Saharan Africa Sub-Saharan Africa (excluding high income)Sub-Saharan Africa (IDA & IBRD countries)SudanSurinameSwazilandSyrian Arab RepublicTajikistanTanzaniaThailandTimor-LesteTogoTongaTrinidad and TobagoTunisiaTurkeyTurkmenistanTurks and Caicos IslandsTuvaluUgandaUkraineUnited Arab EmiratesUpper middle incomeUruguayUzbekistanVanuatuVenezuela, RBVietnamWest Bank and GazaWorldYemen, Rep.ZambiaZimbabwe Timeline:
This timeline shows a graph from 1961 to 2015 of Caribbean small states. No data until 1960. Number of actual observations by date: 55.
Source name:
World Development Indicators
Source organization:
Development Assistance Committee of the Organisation for Economic Co-operation and Development, Geographical Distribution of Financial Flows to Developing Countries, Development Co-operation Report, and International Development Statistics database. Data are available online at: www.oecd.org/dac/stats/idsonline.
Categories, topics:
Aid Effectiveness, Economy & Growth, External Debt
Last updated:
apr 23, 2017
Indicators value changes by year
Minimum:
18.17 mln
jan 1, 1961
Maximum:
692.31 mln
jan 1, 2010
At the date of observation
Value
Absolute change
Change from previous value
jan 1, 1961
18.17 mln
+18.17 mln
0.0%
jan 1, 1962
32.71 mln
+14.54 mln
80.02%
jan 1, 1963
35.95 mln
+3.24 mln
9.91%
jan 1, 1964
38.99 mln
+3.04 mln
8.46%
jan 1, 1965
34.36 mln
-4.63 mln
-11.87%
jan 1, 1966
51.77 mln
+17.41 mln
50.67%
jan 1, 1967
35.79 mln
-15.98 mln
-30.87%
jan 1, 1968
34.28 mln
-1.51 mln
-4.22%
jan 1, 1969
64.12 mln
+29.84 mln
87.05%
jan 1, 1970
63.86 mln
-260.0K
-0.41%
jan 1, 1971
66.85 mln
+2.99 mln
4.68%
jan 1, 1972
81.85 mln
+15.0 mln
22.44%
jan 1, 1973
83.83 mln
+1.98 mln
2.42%
jan 1, 1974
71.09 mln
-12.74 mln
-15.2%
jan 1, 1975
125.41 mln
+54.32 mln
76.41%
jan 1, 1976
135.9 mln
+10.49 mln
8.36%
jan 1, 1977
200.07 mln
+64.17 mln
47.22%
jan 1, 1978
179.9 mln
-20.17 mln
-10.08%
jan 1, 1979
273.53 mln
+93.63 mln
52.05%
jan 1, 1980
312.6 mln
+39.07 mln
14.28%
jan 1, 1981
334.79 mln
+22.19 mln
7.1%
jan 1, 1982
398.78 mln
+63.99 mln
19.11%
jan 1, 1983
398.44 mln
-340.0K
-0.09%
jan 1, 1984
290.19 mln
-108.25 mln
-27.17%
jan 1, 1985
294.56 mln
+4.37 mln
1.51%
jan 1, 1986
313.34 mln
+18.78 mln
6.38%
jan 1, 1987
343.14 mln
+29.8 mln
9.51%
jan 1, 1988
353.4 mln
+10.26 mln
2.99%
jan 1, 1989
376.31 mln
+22.91 mln
6.48%
jan 1, 1990
486.76 mln
+110.45 mln
29.35%
jan 1, 1991
627.79 mln
+141.03 mln
28.97%
jan 1, 1992
444.67 mln
-183.12 mln
-29.17%
jan 1, 1993
407.18 mln
-37.49 mln
-8.43%
jan 1, 1994
391.33 mln
-15.85 mln
-3.89%
jan 1, 1995
408.3 mln
+16.97 mln
4.34%
jan 1, 1996
454.19 mln
+45.89 mln
11.24%
jan 1, 1997
480.56 mln
+26.37 mln
5.81%
jan 1, 1998
529.77 mln
+49.21 mln
10.24%
jan 1, 1999
283.47 mln
-246.3 mln
-46.49%
jan 1, 2000
247.33 mln
-36.14 mln
-12.75%
jan 1, 2001
234.64 mln
-12.69 mln
-5.13%
jan 1, 2002
282.61 mln
+47.97 mln
20.44%
jan 1, 2003
243.67 mln
-38.94 mln
-13.78%
jan 1, 2004
192.38 mln
-51.29 mln
-21.05%
jan 1, 2005
322.29 mln
+129.91 mln
67.53%
jan 1, 2006
344.16 mln
+21.87 mln
6.79%
jan 1, 2007
373.97 mln
+29.81 mln
8.66%
jan 1, 2008
505.45 mln
+131.48 mln
35.16%
jan 1, 2009
550.67 mln
+45.22 mln
8.95%
jan 1, 2010
692.31 mln
+141.64 mln
25.72%
jan 1, 2011
612.11 mln
-80.2 mln
-11.58%
jan 1, 2012
430.36 mln
-181.75 mln
-29.69%
jan 1, 2013
298.58 mln
-131.78 mln
-30.62%
jan 1, 2014
346.24 mln
+47.66 mln
15.96%
jan 1, 2015
384.55 mln
+38.31 mln
11.06%
Ranking of countries by current statistics by years


Comments: