29
/
en
AIzaSyAYiBZKx7MnpbEhh9jyipgxe19OcubqV5w
April 1, 2024
45405
Low & middle income
LMY
false
2
1
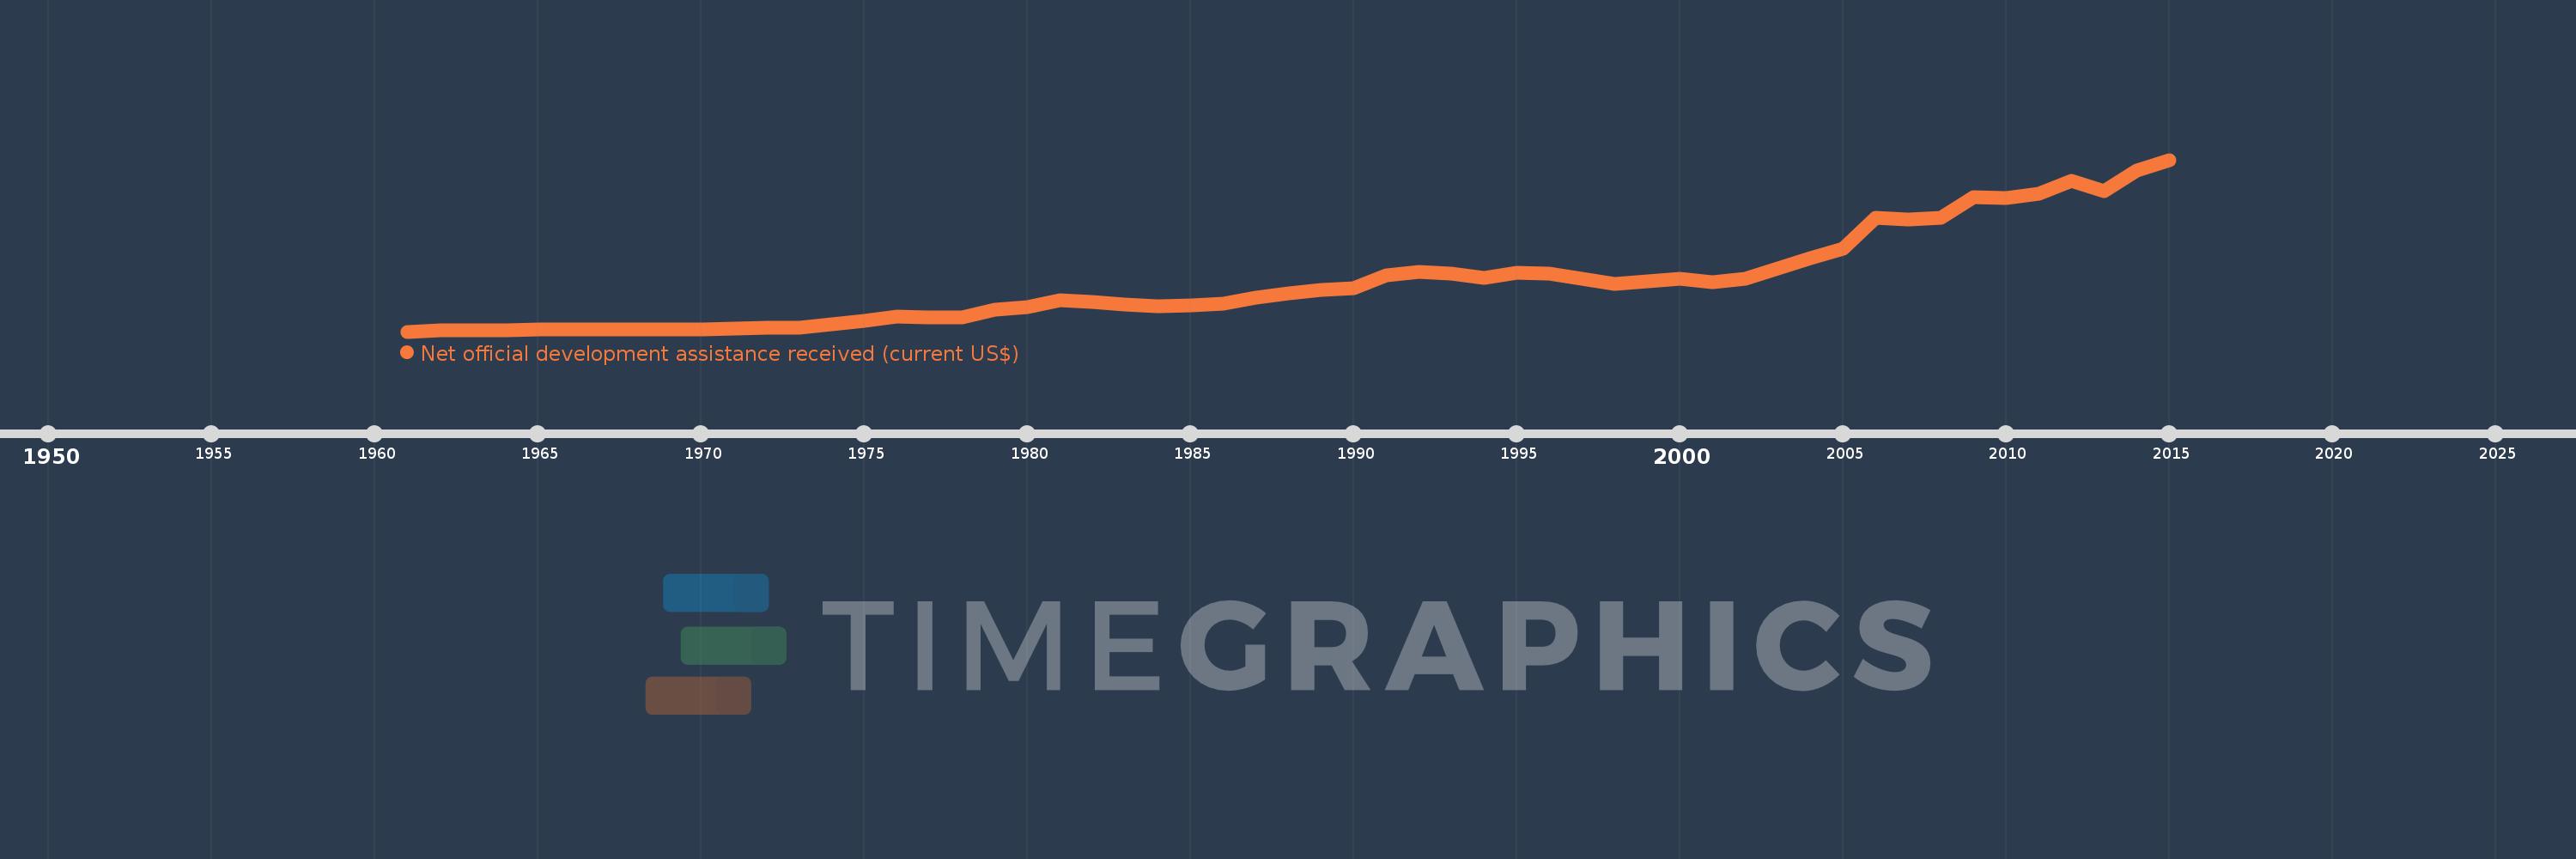
Net official development assistance received (current US$)
2015,2014,2013,2012,2011,2010,2009,2008,2007,2006,2005,2004,2003,2002,2001,2000,1999,1998,1997,1996,1995,1994,1993,1992,1991,1990,1989,1988,1987,1986,1985,1984,1983,1982,1981,1980,1979,1978,1977,1976,1975,1974,1973,1972,1971,1970,1969,1968,1967,1966,1965,1964,1963,1962,1961
This statistics in other country:
AfghanistanAlbaniaAlgeriaAngolaAntigua and BarbudaArab WorldArgentinaArmeniaArubaAzerbaijanBahamas, TheBahrainBangladeshBarbadosBelarusBelizeBeninBermudaBhutanBoliviaBosnia and HerzegovinaBotswanaBrazilBritish Virgin IslandsBrunei DarussalamBurkina FasoBurundiCabo VerdeCambodiaCameroonCaribbean small statesCayman IslandsCentral African RepublicCentral Europe and the BalticsChadChileChinaColombiaComorosCongo, Dem. Rep.Congo, Rep.Costa RicaCote d'IvoireCroatiaCubaCyprusDjiboutiDominicaDominican RepublicEast Asia & PacificEast Asia & Pacific (excluding high income)East Asia & Pacific (IDA & IBRD countries)EcuadorEgypt, Arab Rep.El SalvadorEquatorial GuineaEritreaEthiopiaEuro areaEurope & Central AsiaEurope & Central Asia (excluding high income)Europe & Central Asia (IDA & IBRD countries)European UnionFijiFragile and conflict affected situationsFrench PolynesiaGabonGambia, TheGeorgiaGhanaGibraltarGrenadaGuatemalaGuineaGuinea-BissauGuyanaHaitiHeavily indebted poor countries (HIPC)High incomeHondurasHong Kong SAR, ChinaIBRD onlyIDA & IBRD totalIDA blendIDA onlyIDA totalIndiaIndonesiaIran, Islamic Rep.IraqIsraelJamaicaJordanKazakhstanKenyaKiribatiKorea, Dem. People’s Rep.Korea, Rep.KosovoKuwaitKyrgyz RepublicLao PDRLatin America & Caribbean Latin America & Caribbean (excluding high income)Latin America & the Caribbean (IDA & IBRD countries)Least developed countries: UN classificationLebanonLesothoLiberiaLibyaLow & middle incomeLow incomeLower middle incomeMacao SAR, ChinaMacedonia, FYRMadagascarMalawiMalaysiaMaldivesMaliMaltaMarshall IslandsMauritaniaMauritiusMexicoMicronesia, Fed. Sts.Middle East & North AfricaMiddle East & North Africa (excluding high income)Middle East & North Africa (IDA & IBRD countries)Middle incomeMoldovaMongoliaMontenegroMoroccoMozambiqueMyanmarNamibiaNauruNepalNew CaledoniaNicaraguaNigerNigeriaNorth AmericaNorthern Mariana IslandsOECD membersOmanOther small statesPacific island small statesPakistanPalauPanamaPapua New GuineaParaguayPeruPhilippinesQatarRwandaSamoaSao Tome and PrincipeSaudi ArabiaSenegalSerbiaSeychellesSierra LeoneSingaporeSloveniaSmall statesSolomon IslandsSomaliaSouth AfricaSouth AsiaSouth Asia (IDA & IBRD)South SudanSri LankaSt. Kitts and NevisSt. LuciaSt. Vincent and the GrenadinesSub-Saharan Africa Sub-Saharan Africa (excluding high income)Sub-Saharan Africa (IDA & IBRD countries)SudanSurinameSwazilandSyrian Arab RepublicTajikistanTanzaniaThailandTimor-LesteTogoTongaTrinidad and TobagoTunisiaTurkeyTurkmenistanTurks and Caicos IslandsTuvaluUgandaUkraineUnited Arab EmiratesUpper middle incomeUruguayUzbekistanVanuatuVenezuela, RBVietnamWest Bank and GazaWorldYemen, Rep.ZambiaZimbabwe Timeline:
This timeline shows a graph from 1961 to 2015 of Low & middle income. No data until 1960. Number of actual observations by date: 55.
Source name:
World Development Indicators
Source organization:
Development Assistance Committee of the Organisation for Economic Co-operation and Development, Geographical Distribution of Financial Flows to Developing Countries, Development Co-operation Report, and International Development Statistics database. Data are available online at: www.oecd.org/dac/stats/idsonline.
Categories, topics:
Aid Effectiveness, Economy & Growth, External Debt
Last updated:
apr 23, 2017
Indicators value changes by year
Minimum:
3.685 bln
jan 1, 1961
Maximum:
160.643 bln
jan 1, 2015
At the date of observation
Value
Absolute change
Change from previous value
jan 1, 1961
3.685 bln
+3.685 bln
0.0%
jan 1, 1962
4.582 bln
+897.1 mln
24.35%
jan 1, 1963
4.747 bln
+165.47 mln
3.61%
jan 1, 1964
5.204 bln
+456.94 mln
9.63%
jan 1, 1965
5.347 bln
+142.95 mln
2.75%
jan 1, 1966
5.713 bln
+366.28 mln
6.85%
jan 1, 1967
5.751 bln
+37.61 mln
0.66%
jan 1, 1968
5.974 bln
+223.07 mln
3.88%
jan 1, 1969
5.586 bln
-387.68 mln
-6.49%
jan 1, 1970
5.458 bln
-128.66 mln
-2.3%
jan 1, 1971
6.188 bln
+730.21 mln
13.38%
jan 1, 1972
7.031 bln
+842.56 mln
13.62%
jan 1, 1973
7.4 bln
+369.05 mln
5.25%
jan 1, 1974
10.02 bln
+2.62 bln
35.41%
jan 1, 1975
13.677 bln
+3.657 bln
36.5%
jan 1, 1976
17.375 bln
+3.698 bln
27.04%
jan 1, 1977
16.473 bln
-902.07 mln
-5.19%
jan 1, 1978
16.906 bln
+432.66 mln
2.63%
jan 1, 1979
23.625 bln
+6.719 bln
39.74%
jan 1, 1980
26.348 bln
+2.723 bln
11.53%
jan 1, 1981
32.263 bln
+5.915 bln
22.45%
jan 1, 1982
30.913 bln
-1.35 bln
-4.19%
jan 1, 1983
28.289 bln
-2.623 bln
-8.49%
jan 1, 1984
26.602 bln
-1.687 bln
-5.96%
jan 1, 1985
27.902 bln
+1.3 bln
4.89%
jan 1, 1986
29.257 bln
+1.355 bln
4.85%
jan 1, 1987
34.406 bln
+5.149 bln
17.6%
jan 1, 1988
38.886 bln
+4.48 bln
13.02%
jan 1, 1989
42.103 bln
+3.217 bln
8.27%
jan 1, 1990
43.583 bln
+1.479 bln
3.51%
jan 1, 1991
55.384 bln
+11.801 bln
27.08%
jan 1, 1992
58.388 bln
+3.004 bln
5.42%
jan 1, 1993
56.978 bln
-1.41 bln
-2.42%
jan 1, 1994
52.707 bln
-4.271 bln
-7.5%
jan 1, 1995
57.07 bln
+4.363 bln
8.28%
jan 1, 1996
56.746 bln
-323.2 mln
-0.57%
jan 1, 1997
52.213 bln
-4.533 bln
-7.99%
jan 1, 1998
47.476 bln
-4.737 bln
-9.07%
jan 1, 1999
49.622 bln
+2.146 bln
4.52%
jan 1, 2000
51.62 bln
+1.998 bln
4.03%
jan 1, 2001
49.102 bln
-2.518 bln
-4.88%
jan 1, 2002
51.594 bln
+2.492 bln
5.07%
jan 1, 2003
61.285 bln
+9.691 bln
18.78%
jan 1, 2004
70.892 bln
+9.607 bln
15.68%
jan 1, 2005
79.323 bln
+8.431 bln
11.89%
jan 1, 2006
107.884 bln
+28.561 bln
36.01%
jan 1, 2007
106.356 bln
-1.528 bln
-1.42%
jan 1, 2008
107.402 bln
+1.046 bln
0.98%
jan 1, 2009
126.676 bln
+19.274 bln
17.95%
jan 1, 2010
125.968 bln
-707.8 mln
-0.56%
jan 1, 2011
130.009 bln
+4.04 bln
3.21%
jan 1, 2012
141.16 bln
+11.151 bln
8.58%
jan 1, 2013
132.287 bln
-8.873 bln
-6.29%
jan 1, 2014
150.549 bln
+18.262 bln
13.8%
jan 1, 2015
160.643 bln
+10.094 bln
6.71%
Ranking of countries by current statistics by years


Comments: