29
/
en
AIzaSyAYiBZKx7MnpbEhh9jyipgxe19OcubqV5w
April 1, 2024
62881
World
WLD
false
2
1
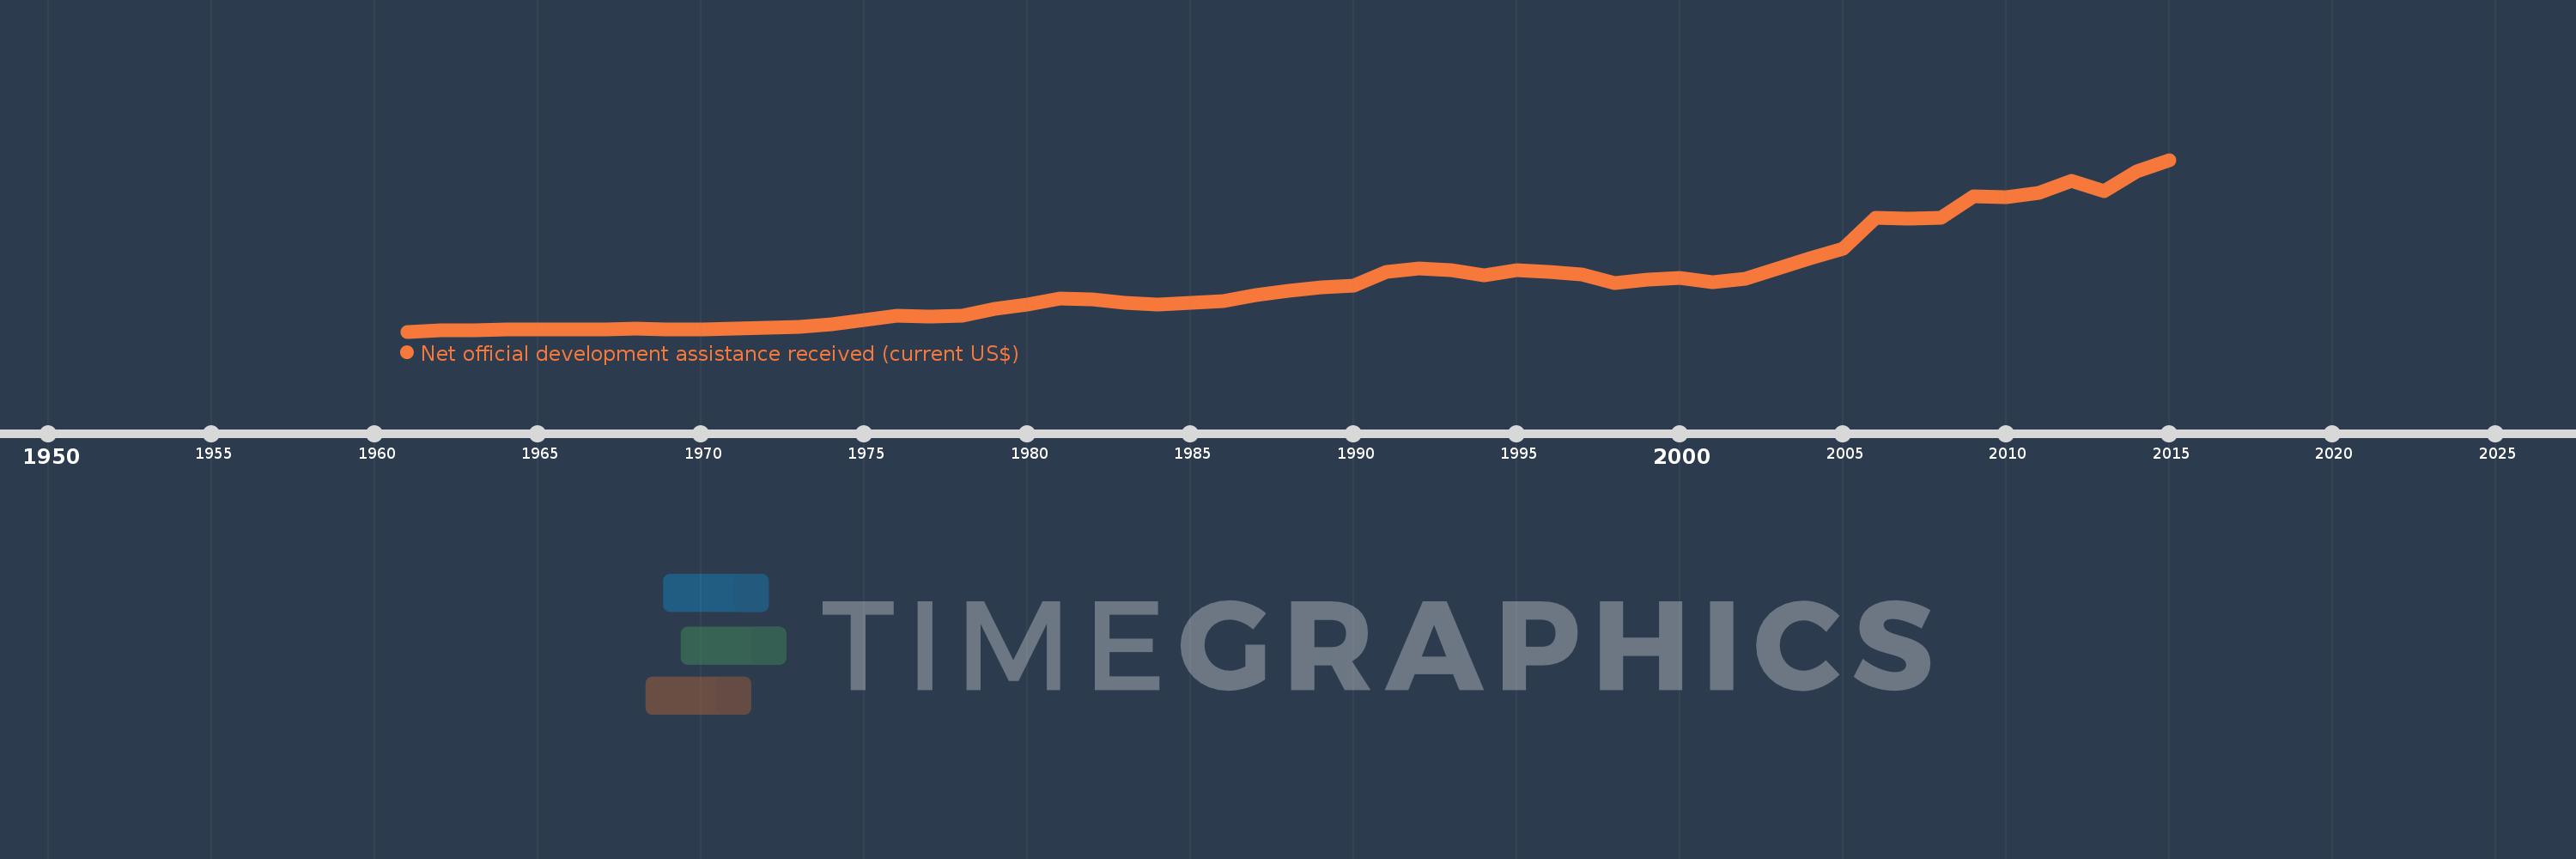
Net official development assistance received (current US$)
2015,2014,2013,2012,2011,2010,2009,2008,2007,2006,2005,2004,2003,2002,2001,2000,1999,1998,1997,1996,1995,1994,1993,1992,1991,1990,1989,1988,1987,1986,1985,1984,1983,1982,1981,1980,1979,1978,1977,1976,1975,1974,1973,1972,1971,1970,1969,1968,1967,1966,1965,1964,1963,1962,1961
This statistics in other country:
AfghanistanAlbaniaAlgeriaAngolaAntigua and BarbudaArab WorldArgentinaArmeniaArubaAzerbaijanBahamas, TheBahrainBangladeshBarbadosBelarusBelizeBeninBermudaBhutanBoliviaBosnia and HerzegovinaBotswanaBrazilBritish Virgin IslandsBrunei DarussalamBurkina FasoBurundiCabo VerdeCambodiaCameroonCaribbean small statesCayman IslandsCentral African RepublicCentral Europe and the BalticsChadChileChinaColombiaComorosCongo, Dem. Rep.Congo, Rep.Costa RicaCote d'IvoireCroatiaCubaCyprusDjiboutiDominicaDominican RepublicEast Asia & PacificEast Asia & Pacific (excluding high income)East Asia & Pacific (IDA & IBRD countries)EcuadorEgypt, Arab Rep.El SalvadorEquatorial GuineaEritreaEthiopiaEuro areaEurope & Central AsiaEurope & Central Asia (excluding high income)Europe & Central Asia (IDA & IBRD countries)European UnionFijiFragile and conflict affected situationsFrench PolynesiaGabonGambia, TheGeorgiaGhanaGibraltarGrenadaGuatemalaGuineaGuinea-BissauGuyanaHaitiHeavily indebted poor countries (HIPC)High incomeHondurasHong Kong SAR, ChinaIBRD onlyIDA & IBRD totalIDA blendIDA onlyIDA totalIndiaIndonesiaIran, Islamic Rep.IraqIsraelJamaicaJordanKazakhstanKenyaKiribatiKorea, Dem. People’s Rep.Korea, Rep.KosovoKuwaitKyrgyz RepublicLao PDRLatin America & Caribbean Latin America & Caribbean (excluding high income)Latin America & the Caribbean (IDA & IBRD countries)Least developed countries: UN classificationLebanonLesothoLiberiaLibyaLow & middle incomeLow incomeLower middle incomeMacao SAR, ChinaMacedonia, FYRMadagascarMalawiMalaysiaMaldivesMaliMaltaMarshall IslandsMauritaniaMauritiusMexicoMicronesia, Fed. Sts.Middle East & North AfricaMiddle East & North Africa (excluding high income)Middle East & North Africa (IDA & IBRD countries)Middle incomeMoldovaMongoliaMontenegroMoroccoMozambiqueMyanmarNamibiaNauruNepalNew CaledoniaNicaraguaNigerNigeriaNorth AmericaNorthern Mariana IslandsOECD membersOmanOther small statesPacific island small statesPakistanPalauPanamaPapua New GuineaParaguayPeruPhilippinesQatarRwandaSamoaSao Tome and PrincipeSaudi ArabiaSenegalSerbiaSeychellesSierra LeoneSingaporeSloveniaSmall statesSolomon IslandsSomaliaSouth AfricaSouth AsiaSouth Asia (IDA & IBRD)South SudanSri LankaSt. Kitts and NevisSt. LuciaSt. Vincent and the GrenadinesSub-Saharan Africa Sub-Saharan Africa (excluding high income)Sub-Saharan Africa (IDA & IBRD countries)SudanSurinameSwazilandSyrian Arab RepublicTajikistanTanzaniaThailandTimor-LesteTogoTongaTrinidad and TobagoTunisiaTurkeyTurkmenistanTurks and Caicos IslandsTuvaluUgandaUkraineUnited Arab EmiratesUpper middle incomeUruguayUzbekistanVanuatuVenezuela, RBVietnamWest Bank and GazaWorldYemen, Rep.ZambiaZimbabwe Timeline:
This timeline shows a graph from 1961 to 2015 of World. No data until 1960. Number of actual observations by date: 55.
Source name:
World Development Indicators
Source organization:
Development Assistance Committee of the Organisation for Economic Co-operation and Development, Geographical Distribution of Financial Flows to Developing Countries, Development Co-operation Report, and International Development Statistics database. Data are available online at: www.oecd.org/dac/stats/idsonline.
Categories, topics:
Aid Effectiveness, Economy & Growth, External Debt
Last updated:
apr 23, 2017
Indicators value changes by year
Minimum:
4.254 bln
jan 1, 1961
Maximum:
161.075 bln
jan 1, 2015
At the date of observation
Value
Absolute change
Change from previous value
jan 1, 1961
4.254 bln
+4.254 bln
0.0%
jan 1, 1962
5.219 bln
+964.63 mln
22.67%
jan 1, 1963
5.44 bln
+220.66 mln
4.23%
jan 1, 1964
5.962 bln
+522.77 mln
9.61%
jan 1, 1965
5.835 bln
-127.11 mln
-2.13%
jan 1, 1966
6.243 bln
+407.3 mln
6.98%
jan 1, 1967
6.415 bln
+171.95 mln
2.75%
jan 1, 1968
6.621 bln
+206.82 mln
3.22%
jan 1, 1969
6.303 bln
-318.21 mln
-4.81%
jan 1, 1970
6.174 bln
-129.2 mln
-2.05%
jan 1, 1971
6.836 bln
+661.9 mln
10.72%
jan 1, 1972
7.761 bln
+925.47 mln
13.54%
jan 1, 1973
8.243 bln
+482.12 mln
6.21%
jan 1, 1974
10.925 bln
+2.681 bln
32.53%
jan 1, 1975
14.636 bln
+3.711 bln
33.97%
jan 1, 1976
18.79 bln
+4.154 bln
28.38%
jan 1, 1977
18.103 bln
-687.0 mln
-3.66%
jan 1, 1978
18.943 bln
+840.54 mln
4.64%
jan 1, 1979
25.379 bln
+6.436 bln
33.98%
jan 1, 1980
28.72 bln
+3.341 bln
13.16%
jan 1, 1981
34.513 bln
+5.792 bln
20.17%
jan 1, 1982
33.268 bln
-1.244 bln
-3.6%
jan 1, 1983
30.282 bln
-2.986 bln
-8.98%
jan 1, 1984
29.117 bln
-1.165 bln
-3.85%
jan 1, 1985
30.261 bln
+1.144 bln
3.93%
jan 1, 1986
32.227 bln
+1.966 bln
6.5%
jan 1, 1987
37.693 bln
+5.467 bln
16.96%
jan 1, 1988
41.575 bln
+3.882 bln
10.3%
jan 1, 1989
44.664 bln
+3.089 bln
7.43%
jan 1, 1990
46.357 bln
+1.692 bln
3.79%
jan 1, 1991
58.479 bln
+12.122 bln
26.15%
jan 1, 1992
61.79 bln
+3.311 bln
5.66%
jan 1, 1993
60.668 bln
-1.121 bln
-1.81%
jan 1, 1994
55.922 bln
-4.747 bln
-7.82%
jan 1, 1995
60.069 bln
+4.148 bln
7.42%
jan 1, 1996
59.037 bln
-1.032 bln
-1.72%
jan 1, 1997
56.27 bln
-2.767 bln
-4.69%
jan 1, 1998
48.944 bln
-7.327 bln
-13.02%
jan 1, 1999
51.648 bln
+2.705 bln
5.53%
jan 1, 2000
52.89 bln
+1.242 bln
2.4%
jan 1, 2001
49.673 bln
-3.217 bln
-6.08%
jan 1, 2002
52.27 bln
+2.597 bln
5.23%
jan 1, 2003
61.911 bln
+9.641 bln
18.44%
jan 1, 2004
71.58 bln
+9.669 bln
15.62%
jan 1, 2005
79.916 bln
+8.336 bln
11.65%
jan 1, 2006
108.451 bln
+28.535 bln
35.71%
jan 1, 2007
107.003 bln
-1.448 bln
-1.33%
jan 1, 2008
108.081 bln
+1.078 bln
1.01%
jan 1, 2009
127.443 bln
+19.362 bln
17.91%
jan 1, 2010
126.689 bln
-754.4 mln
-0.59%
jan 1, 2011
130.736 bln
+4.048 bln
3.19%
jan 1, 2012
141.56 bln
+10.824 bln
8.28%
jan 1, 2013
132.738 bln
-8.822 bln
-6.23%
jan 1, 2014
150.8 bln
+18.062 bln
13.61%
jan 1, 2015
161.075 bln
+10.274 bln
6.81%
Ranking of countries by current statistics by years


Comments: