29
/
en
AIzaSyAYiBZKx7MnpbEhh9jyipgxe19OcubqV5w
April 1, 2024
251707
St. Vincent and the Grenadines
VCT
true
2
1
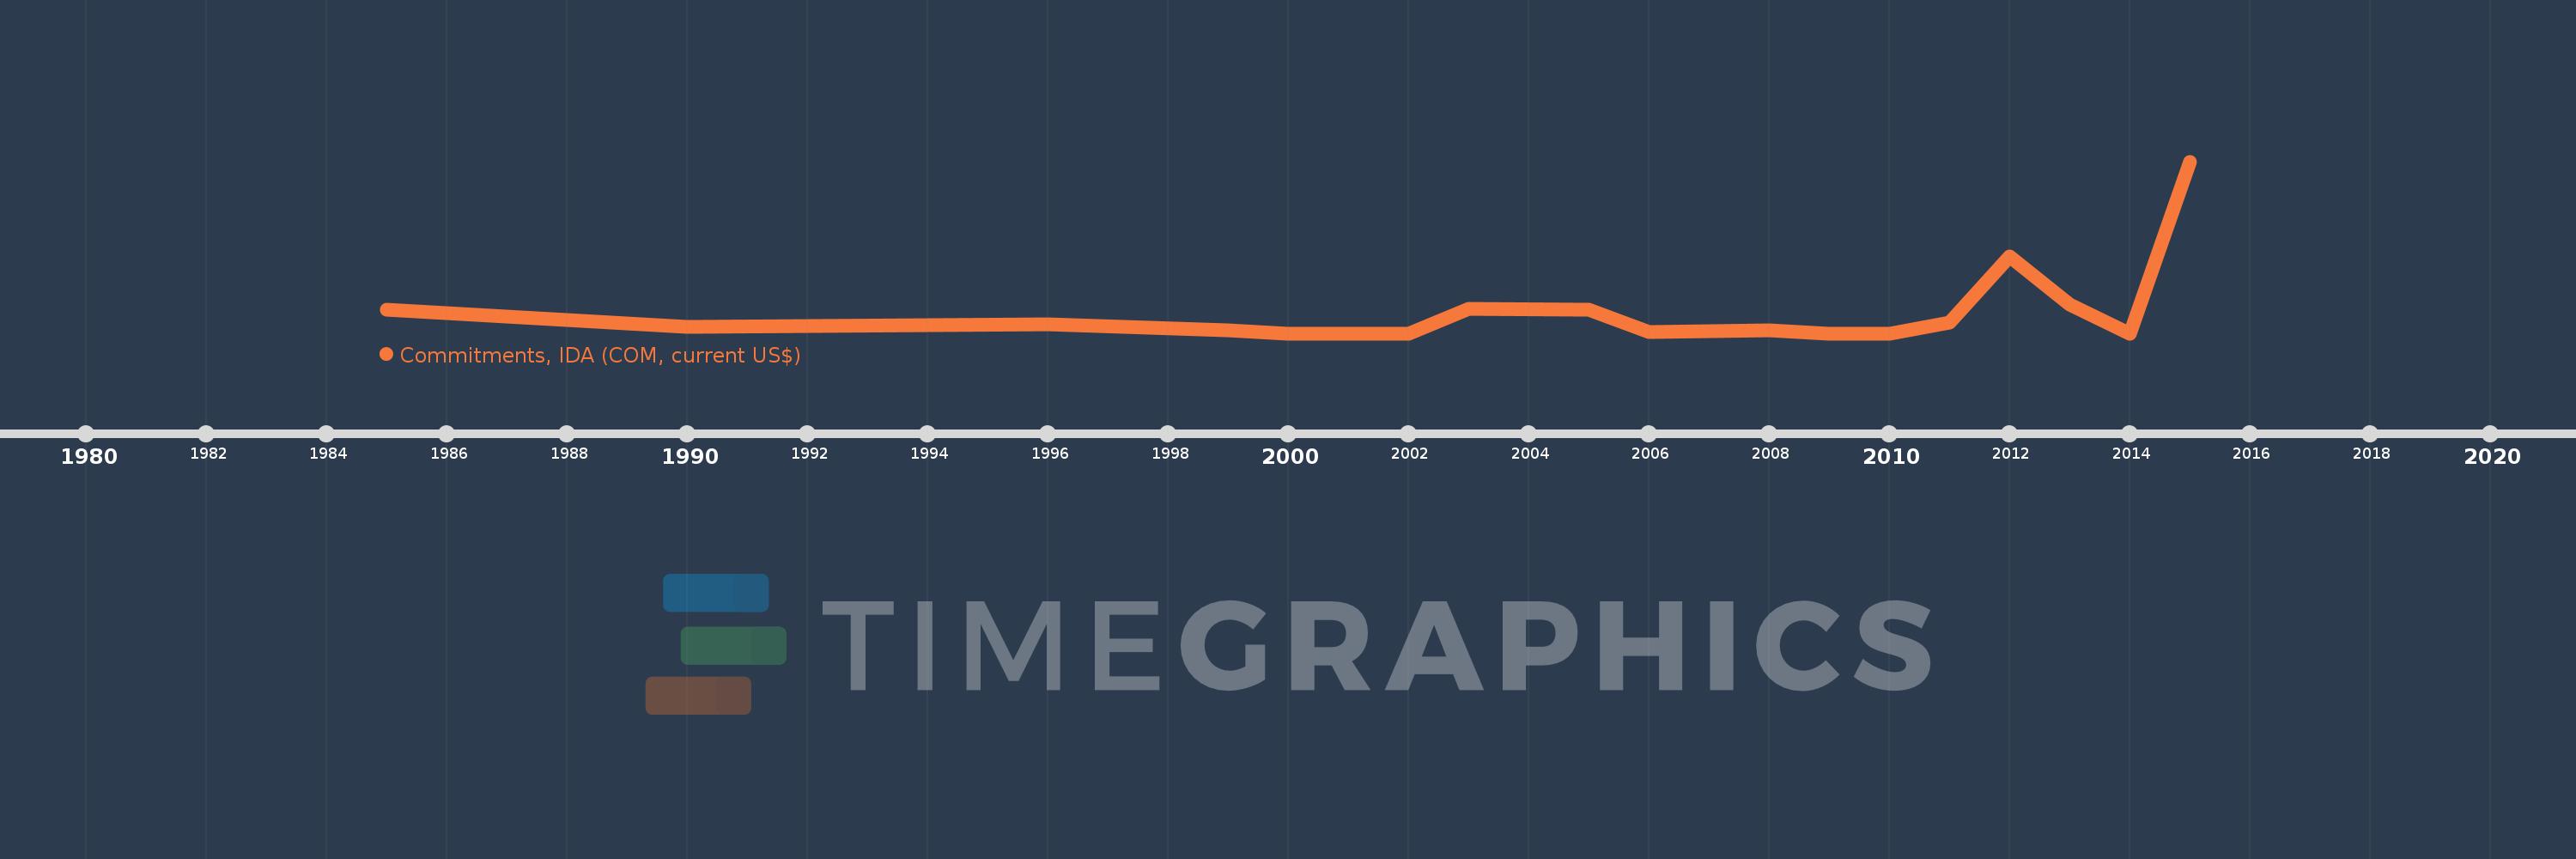
Commitments, IDA (COM, current US$)
2015,2014,2013,2012,2011,2010,2009,2008,2006,2005,2003,2002,2000,1999,1996,1990,1985
This statistics in other country:
Timeline:
This timeline shows a graph from 1985 to 2015 of St. Vincent and the Grenadines. No data until 1984. Number of actual observations by date: 17.
Source name:
World Development Indicators
Source organization:
World Bank, International Debt Statistics.
Categories, topics:
External Debt
Last updated:
apr 23, 2017
Indicators value changes by year
Maximum:
35.6 mln
jan 1, 2015
At the date of observation
Value
Absolute change
Change from previous value
jan 1, 1985
4.819 mln
+4.819 mln
0.0%
jan 1, 1990
1.41 mln
-3.409 mln
-70.74%
jan 1, 1996
1.8 mln
+390.0K
27.66%
jan 1, 1999
600.0K
-1.2 mln
-66.67%
jan 1, 2000
0.0
-600.0K
-100.0%
jan 1, 2003
5.15 mln
+5.15 mln
%
jan 1, 2005
4.85 mln
-300.0K
-5.83%
jan 1, 2006
271.0K
-4.579 mln
-94.41%
jan 1, 2008
700.0K
+429.0K
158.3%
jan 1, 2009
0.0
-700.0K
-100.0%
jan 1, 2011
2.3 mln
+2.3 mln
%
jan 1, 2012
15.92 mln
+13.62 mln
592.17%
jan 1, 2013
6.0 mln
-9.92 mln
-62.31%
jan 1, 2014
0.0
-6.0 mln
-100.0%
jan 1, 2015
35.6 mln
+35.6 mln
%
Ranking of countries by current statistics by years


Comments: