29
/
en
AIzaSyAYiBZKx7MnpbEhh9jyipgxe19OcubqV5w
April 1, 2024
120742
Dominica
DMA
true
2
1
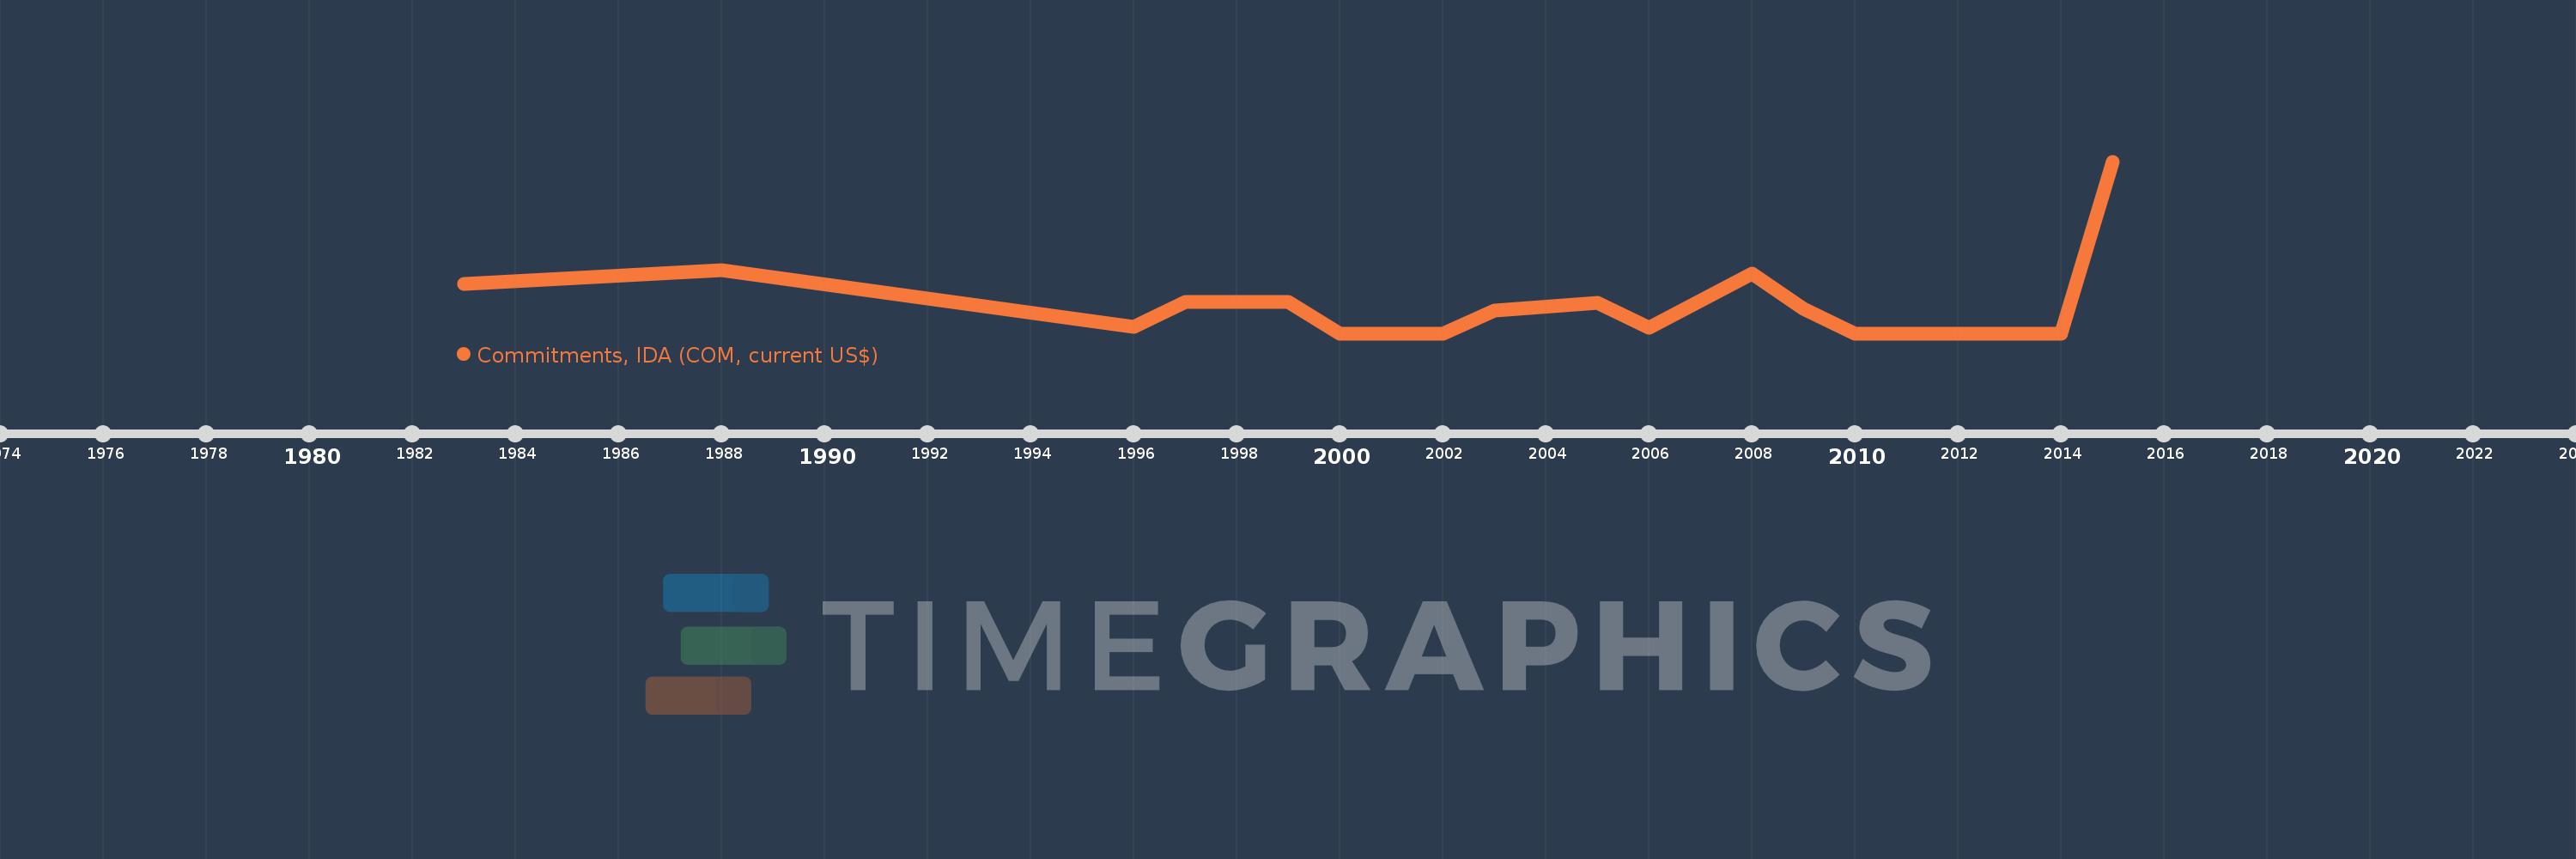
Commitments, IDA (COM, current US$)
2015,2014,2013,2011,2010,2009,2008,2006,2005,2003,2002,2000,1999,1997,1996,1988,1983
This statistics in other country:
Timeline:
This timeline shows a graph from 1983 to 2015 of Dominica. No data until 1982. Number of actual observations by date: 17.
Source name:
World Development Indicators
Source organization:
World Bank, International Debt Statistics.
Categories, topics:
External Debt
Last updated:
apr 23, 2017
Indicators value changes by year
Maximum:
17.0 mln
jan 1, 2015
At the date of observation
Value
Absolute change
Change from previous value
jan 1, 1983
4.859 mln
+4.859 mln
0.0%
jan 1, 1988
6.288 mln
+1.429 mln
29.41%
jan 1, 1996
600.0K
-5.688 mln
-90.46%
jan 1, 1997
3.07 mln
+2.47 mln
411.67%
jan 1, 1999
3.1 mln
+30.0K
0.98%
jan 1, 2000
0.0
-3.1 mln
-100.0%
jan 1, 2003
2.24 mln
+2.24 mln
%
jan 1, 2005
3.0 mln
+760.0K
33.93%
jan 1, 2006
542.0K
-2.458 mln
-81.93%
jan 1, 2008
5.95 mln
+5.408 mln
997.79%
jan 1, 2009
2.4 mln
-3.55 mln
-59.66%
jan 1, 2010
0.0
-2.4 mln
-100.0%
jan 1, 2015
17.0 mln
+17.0 mln
%
Ranking of countries by current statistics by years


Comments: