29
/
en
AIzaSyAYiBZKx7MnpbEhh9jyipgxe19OcubqV5w
April 1, 2024
265574
Tonga
TON
true
2
1
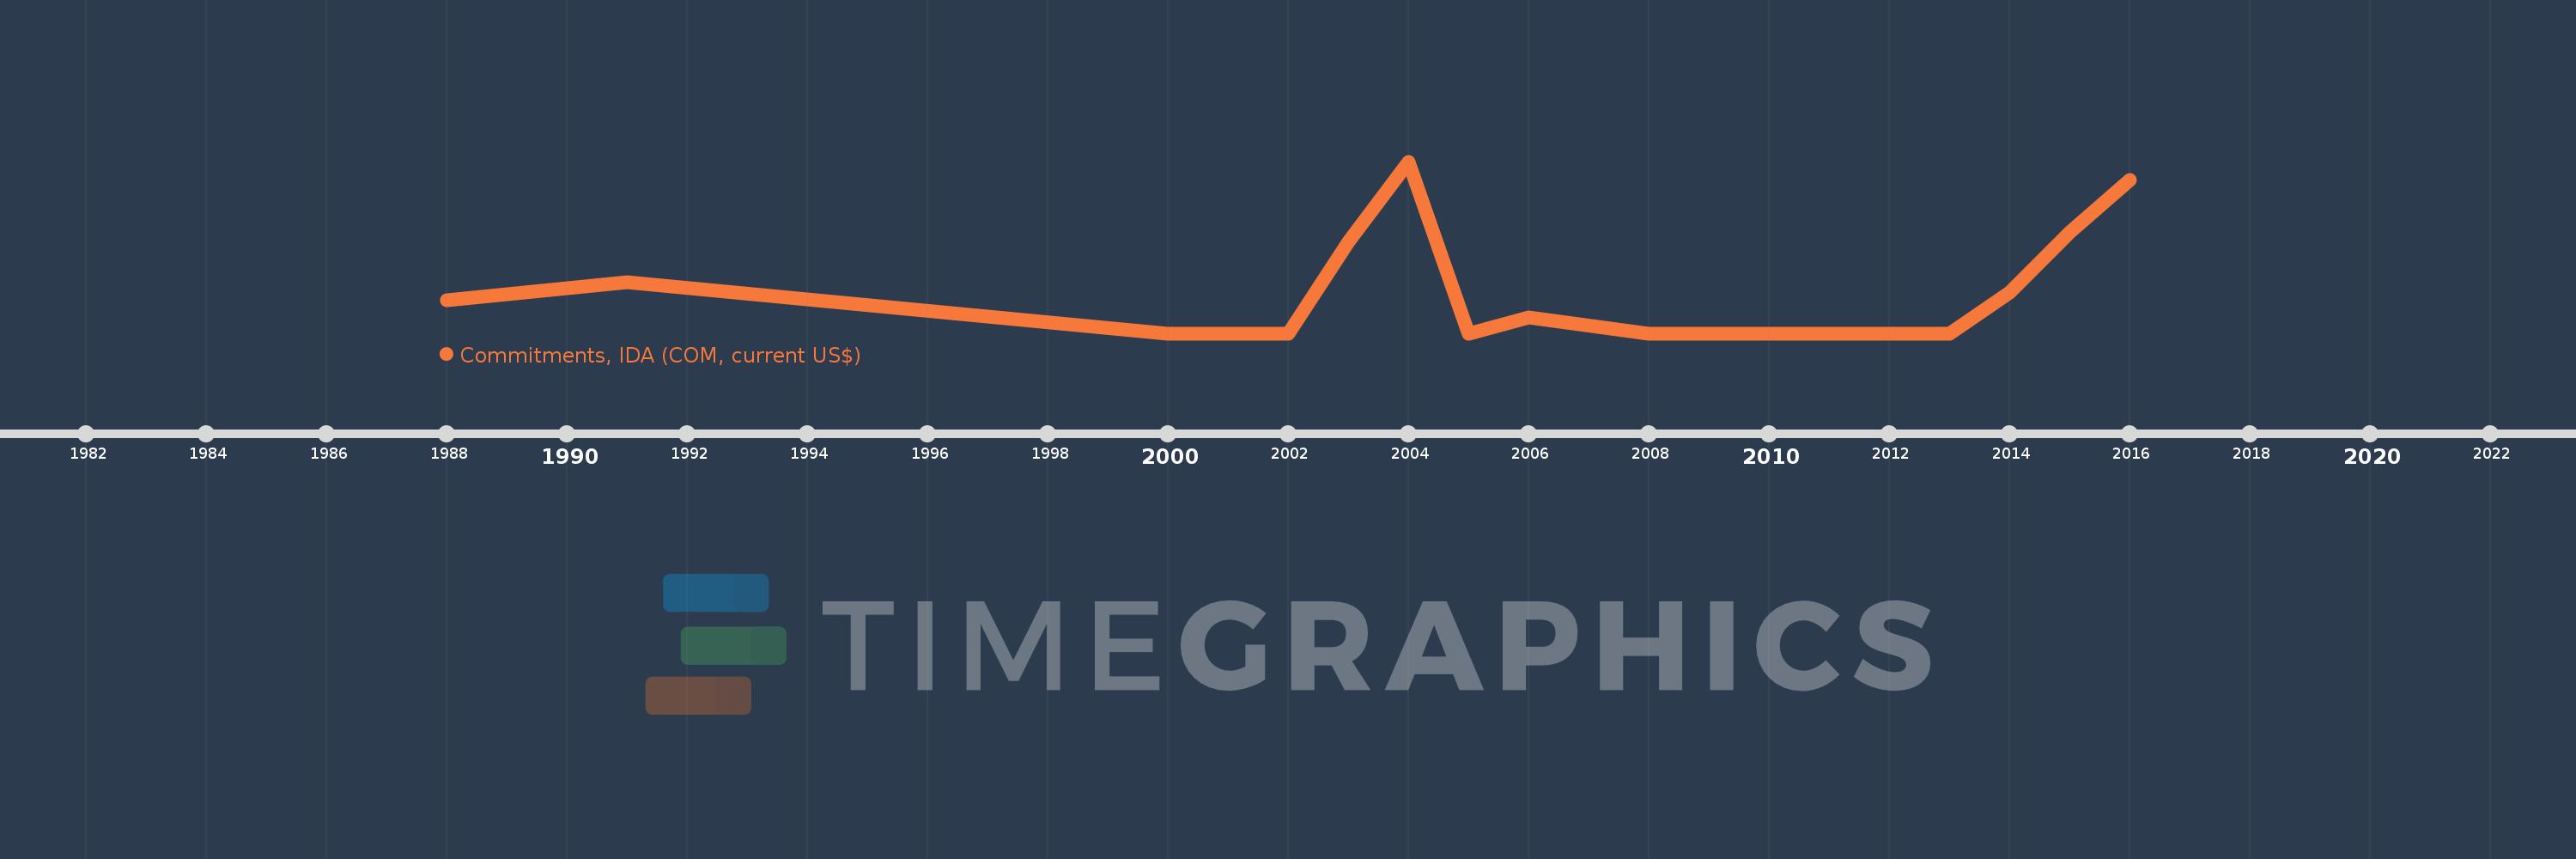
Commitments, IDA (COM, current US$)
2016,2015,2014,2013,2011,2010,2009,2008,2006,2005,2004,2003,2002,2000,1991,1988
This statistics in other country:
Timeline:
This timeline shows a graph from 1988 to 2016 of Tonga. No data until 1987. Number of actual observations by date: 16.
Source name:
World Development Indicators
Source organization:
World Bank, International Debt Statistics.
Categories, topics:
External Debt
Last updated:
apr 23, 2017
Indicators value changes by year
Maximum:
10.94 mln
jan 1, 2004
At the date of observation
Value
Absolute change
Change from previous value
jan 1, 1988
2.096 mln
+2.096 mln
0.0%
jan 1, 1991
3.258 mln
+1.162 mln
55.44%
jan 1, 2000
0.0
-3.258 mln
-100.0%
jan 1, 2003
5.85 mln
+5.85 mln
%
jan 1, 2004
10.94 mln
+5.09 mln
87.01%
jan 1, 2005
0.0
-10.94 mln
-100.0%
jan 1, 2006
1000.0K
+1000.0K
%
jan 1, 2008
0.0
-1000.0K
-100.0%
jan 1, 2014
2.618 mln
+2.618 mln
%
jan 1, 2015
6.4 mln
+3.782 mln
144.46%
jan 1, 2016
9.75 mln
+3.35 mln
52.34%
Ranking of countries by current statistics by years


Comments: