29
/
en
AIzaSyAYiBZKx7MnpbEhh9jyipgxe19OcubqV5w
April 1, 2024
248962
Sri Lanka
LKA
true
2
1
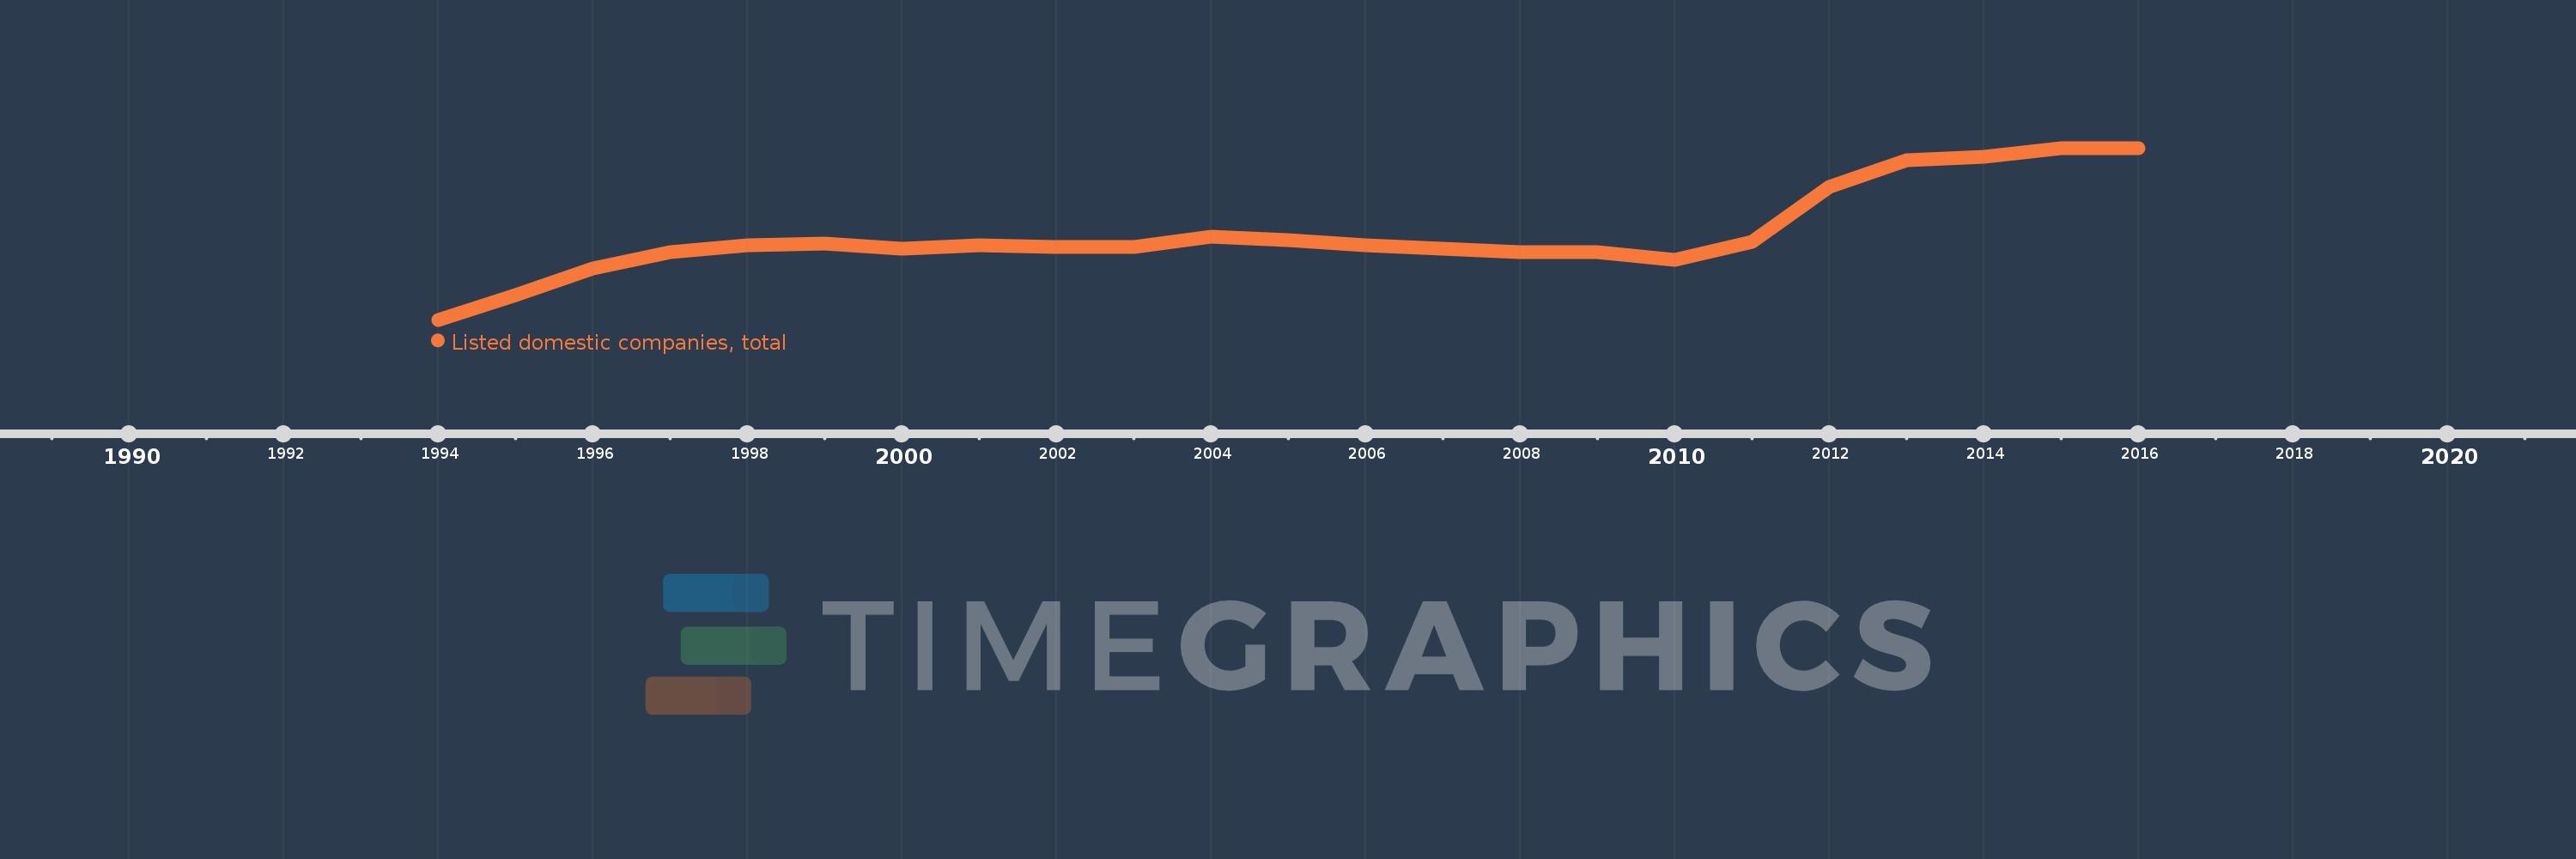
Listed domestic companies, total
2016,2015,2014,2013,2012,2011,2010,2009,2008,2007,2006,2005,2004,2003,2002,2001,2000,1999,1998,1997,1996,1995,1994
This statistics in other country:
Timeline:
This timeline shows a graph from 1994 to 2016 of Sri Lanka. No data until 1993. Number of actual observations by date: 23.
Source name:
World Development Indicators
Source organization:
World Federation of Exchanges database.
Categories, topics:
Financial Sector
Last updated:
apr 23, 2017
Indicators value changes by year
At the date of observation
Value
Absolute change
Change from previous value
jan 1, 1994
197.0
+197.0
0.0%
jan 1, 1995
211.0
+14.0
7.11%
jan 1, 1996
226.0
+15.0
7.11%
jan 1, 1997
235.0
+9.0
3.98%
jan 1, 1998
239.0
+4.0
1.7%
jan 1, 1999
240.0
+1.0
0.42%
jan 1, 2000
237.0
-3.0
-1.25%
jan 1, 2001
239.0
+2.0
0.84%
jan 1, 2002
238.0
-1.0
-0.42%
jan 1, 2003
238.0
0.0
0.0%
jan 1, 2004
244.0
+6.0
2.52%
jan 1, 2005
242.0
-2.0
-0.82%
jan 1, 2006
239.0
-3.0
-1.24%
jan 1, 2007
237.0
-2.0
-0.84%
jan 1, 2008
235.0
-2.0
-0.84%
jan 1, 2009
235.0
0.0
0.0%
jan 1, 2010
231.0
-4.0
-1.7%
jan 1, 2011
241.0
+10.0
4.33%
jan 1, 2012
272.0
+31.0
12.86%
jan 1, 2013
287.0
+15.0
5.51%
jan 1, 2014
289.0
+2.0
0.7%
jan 1, 2015
294.0
+5.0
1.73%
jan 1, 2016
294.0
0.0
0.0%
Ranking of countries by current statistics by years


Comments: