29
/
en
AIzaSyAYiBZKx7MnpbEhh9jyipgxe19OcubqV5w
April 1, 2024
93808
Bulgaria
BGR
true
2
1
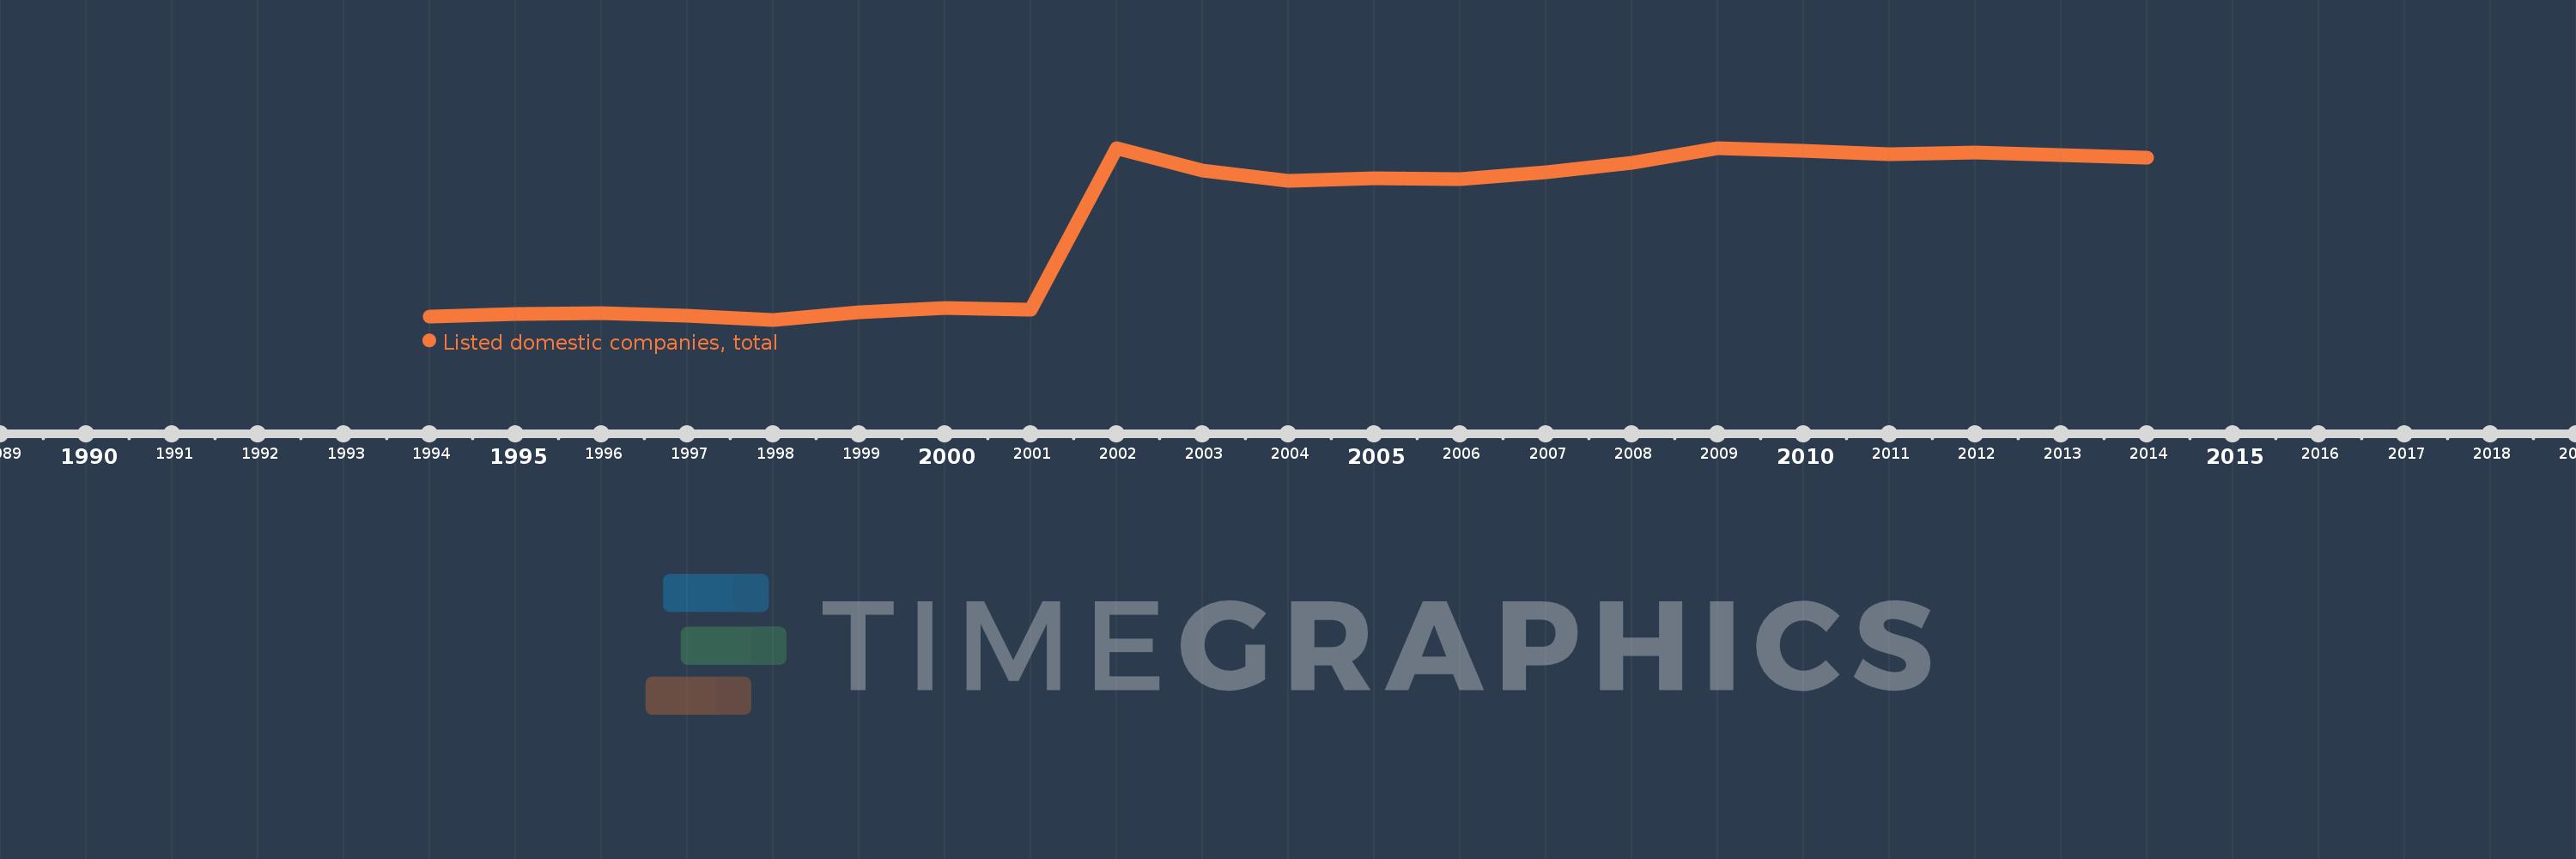
Listed domestic companies, total
2014,2013,2012,2011,2010,2009,2008,2007,2006,2005,2004,2003,2002,2001,2000,1999,1998,1997,1996,1995,1994
This statistics in other country:
Timeline:
This timeline shows a graph from 1994 to 2014 of Bulgaria. No data until 1993. Number of actual observations by date: 21.
Source name:
World Development Indicators
Source organization:
World Federation of Exchanges database.
Categories, topics:
Financial Sector
Last updated:
apr 23, 2017
Indicators value changes by year
At the date of observation
Value
Absolute change
Change from previous value
jan 1, 1995
13.0
+5.0
62.5%
jan 1, 1996
15.0
+2.0
15.38%
jan 1, 1997
9.0
-6.0
-40.0%
jan 1, 1998
0.0
-9.0
-100.0%
jan 1, 2000
28.0
+10.0
55.56%
jan 1, 2001
23.0
-5.0
-17.86%
jan 1, 2002
404.0
+381.0
1.66K%
jan 1, 2003
351.0
-53.0
-13.12%
jan 1, 2004
326.0
-25.0
-7.12%
jan 1, 2005
332.0
+6.0
1.84%
jan 1, 2006
331.0
-1.0
-0.3%
jan 1, 2007
347.0
+16.0
4.83%
jan 1, 2008
369.0
+22.0
6.34%
jan 1, 2009
404.0
+35.0
9.49%
jan 1, 2010
398.0
-6.0
-1.49%
jan 1, 2011
390.0
-8.0
-2.01%
jan 1, 2012
393.0
+3.0
0.77%
jan 1, 2013
387.0
-6.0
-1.53%
jan 1, 2014
381.0
-6.0
-1.55%
Ranking of countries by current statistics by years


Comments: