29
/
en
AIzaSyAYiBZKx7MnpbEhh9jyipgxe19OcubqV5w
April 1, 2024
105096
Chile
CHL
true
2
1
Listed domestic companies, total
2016,2015,2014,2013,2012,2011,2010,2009,2008,2007,2006,2005,2004,2003,2002,2001,2000,1999,1998,1997,1996,1995,1994,1993,1992,1991,1990,1989,1988,1987,1986,1985
Download
Global statistics library →Chile →

Listed domestic companies, total

This statistics in other country:
Arab WorldArgentinaArmeniaAustraliaAustriaAzerbaijanBahrainBangladeshBarbadosBelarusBelgiumBermudaBhutanBoliviaBosnia and HerzegovinaBotswanaBrazilBulgariaCanadaCayman IslandsCentral Europe and the BalticsChannel IslandsChileChinaColombiaCosta RicaCote d'IvoireCroatiaCyprusCzech RepublicDenmarkDominican RepublicEarly-demographic dividendEast Asia & PacificEast Asia & Pacific (excluding high income)East Asia & Pacific (IDA & IBRD countries)EcuadorEgypt, Arab Rep.El SalvadorEstoniaEuro areaEurope & Central AsiaEurope & Central Asia (excluding high income)Europe & Central Asia (IDA & IBRD countries)European UnionFijiFinlandFranceGeorgiaGermanyGhanaGreeceGuatemalaGuyanaHigh incomeHondurasHong Kong SAR, ChinaHungaryIBRD onlyIcelandIDA & IBRD totalIDA blendIDA totalIndiaIndonesiaIran, Islamic Rep.IrelandIsraelItalyJamaicaJapanJordanKazakhstanKenyaKorea, Dem. People’s Rep.Korea, Rep.KuwaitKyrgyz RepublicLate-demographic dividendLatin America & Caribbean Latin America & Caribbean (excluding high income)Latin America & the Caribbean (IDA & IBRD countries)LatviaLebanonLithuaniaLow & middle incomeLower middle incomeLuxembourgMacedonia, FYRMalawiMalaysiaMaltaMauritiusMexicoMiddle East & North AfricaMiddle East & North Africa (excluding high income)Middle East & North Africa (IDA & IBRD countries)Middle incomeMoldovaMongoliaMontenegroMoroccoNamibiaNepalNetherlandsNew ZealandNigeriaNorth AmericaNorwayOECD membersOmanOther small statesPakistanPanamaPapua New GuineaParaguayPeruPhilippinesPolandPortugalPost-demographic dividendQatarRomaniaRussian FederationSaudi ArabiaSerbiaSeychellesSingaporeSlovak RepublicSloveniaSouth AfricaSouth AsiaSouth Asia (IDA & IBRD)SpainSri LankaSt. Kitts and NevisSub-Saharan Africa Sub-Saharan Africa (excluding high income)Sub-Saharan Africa (IDA & IBRD countries)SwazilandSwedenSwitzerlandTanzaniaThailandTrinidad and TobagoTunisiaTurkeyUgandaUkraineUnited Arab EmiratesUnited KingdomUnited StatesUpper middle incomeUruguayUzbekistanVenezuela, RBVietnamWest Bank and GazaWorldZambiaZimbabwe
Timeline:
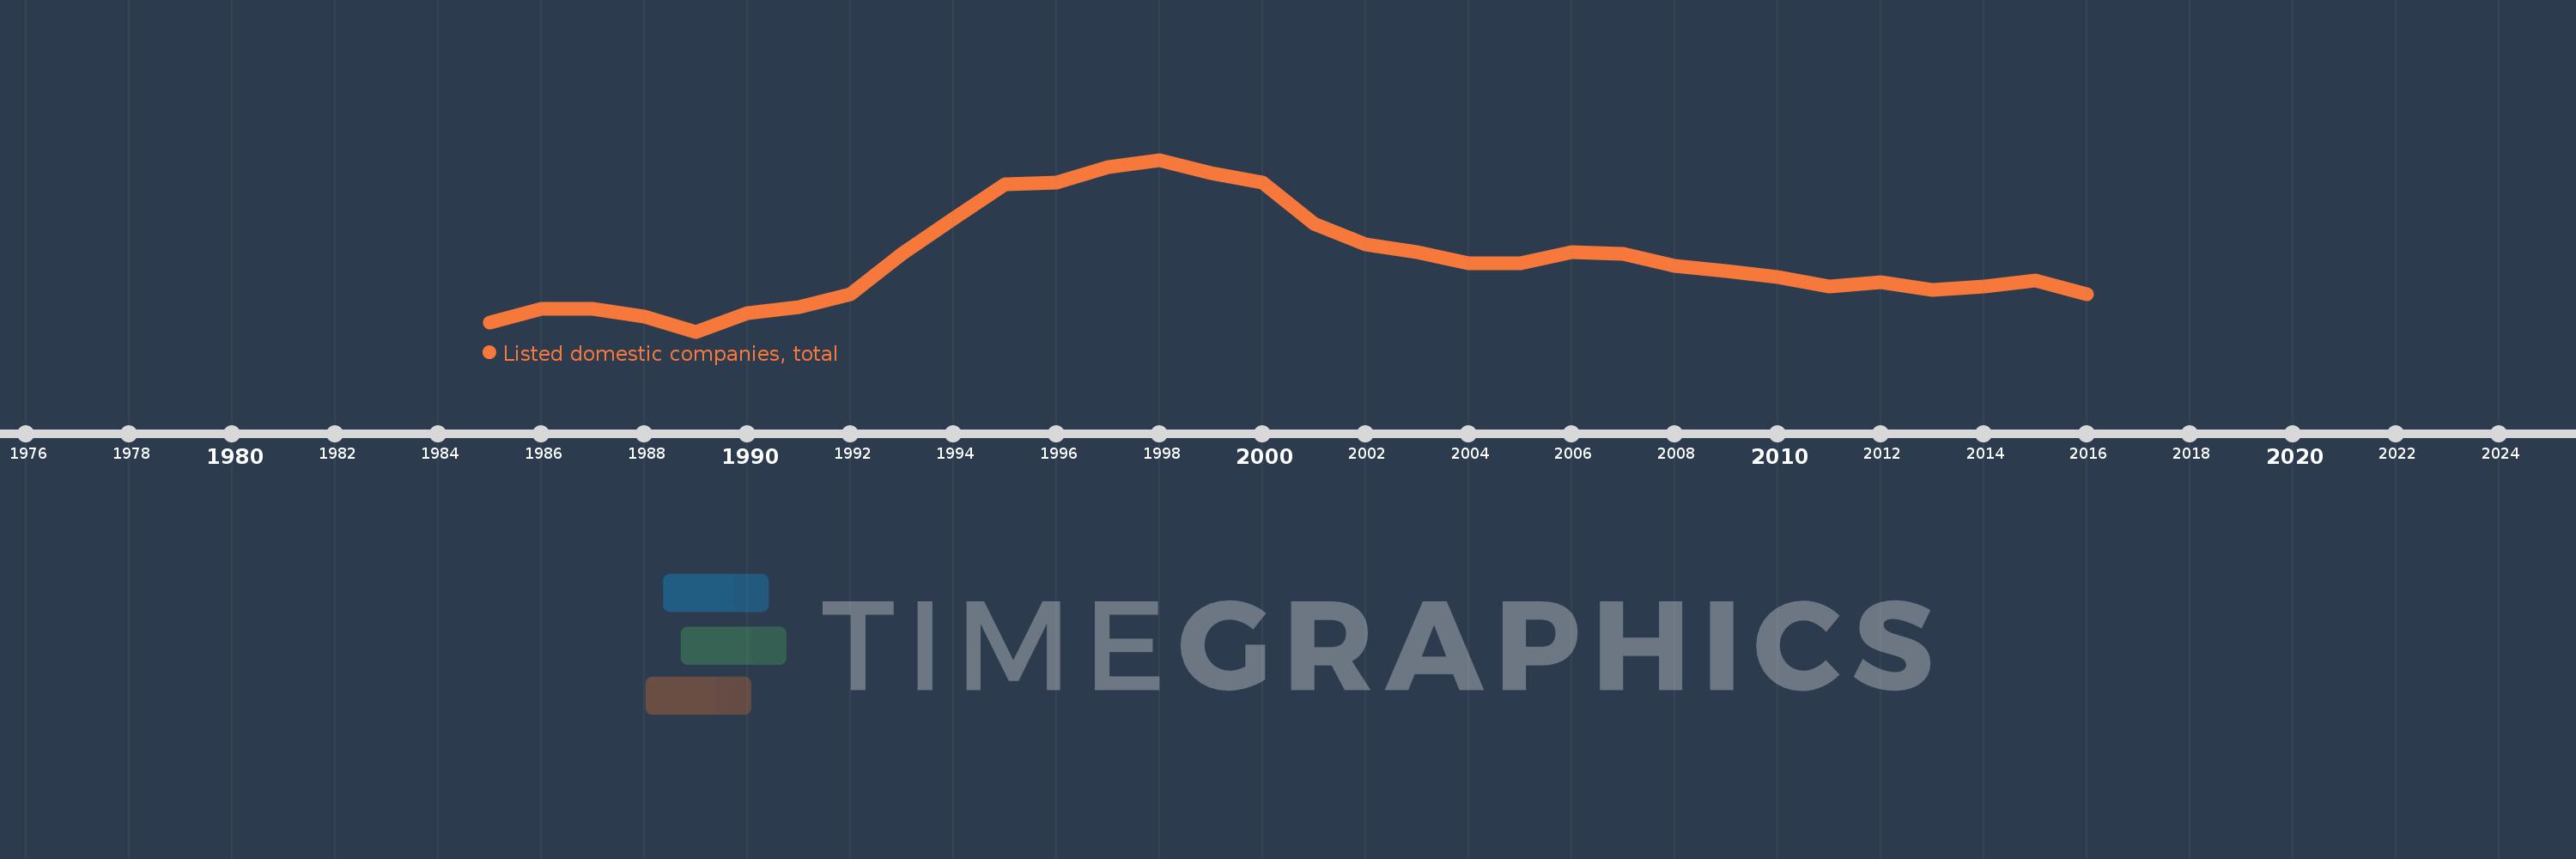
This timeline shows a graph from 1985 to 2016 of Chile. No data until 1984. Number of actual observations by date: 32.
Source name:
World Development Indicators
Source organization:
World Federation of Exchanges database.
Categories, topics:
Financial Sector
Last updated:
apr 23, 2017
Indicators value changes by year
Mean:
241.063
Minimum:
203.0
jan 1, 1989
Maximum:
294.0
jan 1, 1998
At the date of observation
Value
Absolute change
Change from previous value
jan 1, 1985
208.0
+208.0
0.0%
jan 1, 1986
215.0
+7.0
3.37%
jan 1, 1987
215.0
0.0
0.0%
jan 1, 1988
211.0
-4.0
-1.86%
jan 1, 1989
203.0
-8.0
-3.79%
jan 1, 1990
213.0
+10.0
4.93%
jan 1, 1991
216.0
+3.0
1.41%
jan 1, 1992
223.0
+7.0
3.24%
jan 1, 1993
244.0
+21.0
9.42%
jan 1, 1994
263.0
+19.0
7.79%
jan 1, 1995
281.0
+18.0
6.84%
jan 1, 1996
282.0
+1.0
0.36%
jan 1, 1997
290.0
+8.0
2.84%
jan 1, 1998
294.0
+4.0
1.38%
jan 1, 1999
287.0
-7.0
-2.38%
jan 1, 2000
282.0
-5.0
-1.74%
jan 1, 2001
260.0
-22.0
-7.8%
jan 1, 2002
249.0
-11.0
-4.23%
jan 1, 2003
245.0
-4.0
-1.61%
jan 1, 2004
239.0
-6.0
-2.45%
jan 1, 2005
239.0
0.0
0.0%
jan 1, 2006
245.0
+6.0
2.51%
jan 1, 2007
244.0
-1.0
-0.41%
jan 1, 2008
238.0
-6.0
-2.46%
jan 1, 2009
235.0
-3.0
-1.26%
jan 1, 2010
232.0
-3.0
-1.28%
jan 1, 2011
227.0
-5.0
-2.16%
jan 1, 2012
229.0
+2.0
0.88%
jan 1, 2013
225.0
-4.0
-1.75%
jan 1, 2014
227.0
+2.0
0.89%
jan 1, 2015
230.0
+3.0
1.32%
jan 1, 2016
223.0
-7.0
-3.04%
Ranking of countries by current statistics by years

Comments:

Send
PremiumAbout & FeedbackTermsPrivacy
logo
© 2022 Selected Technologies LLC – Morgan Hill, California