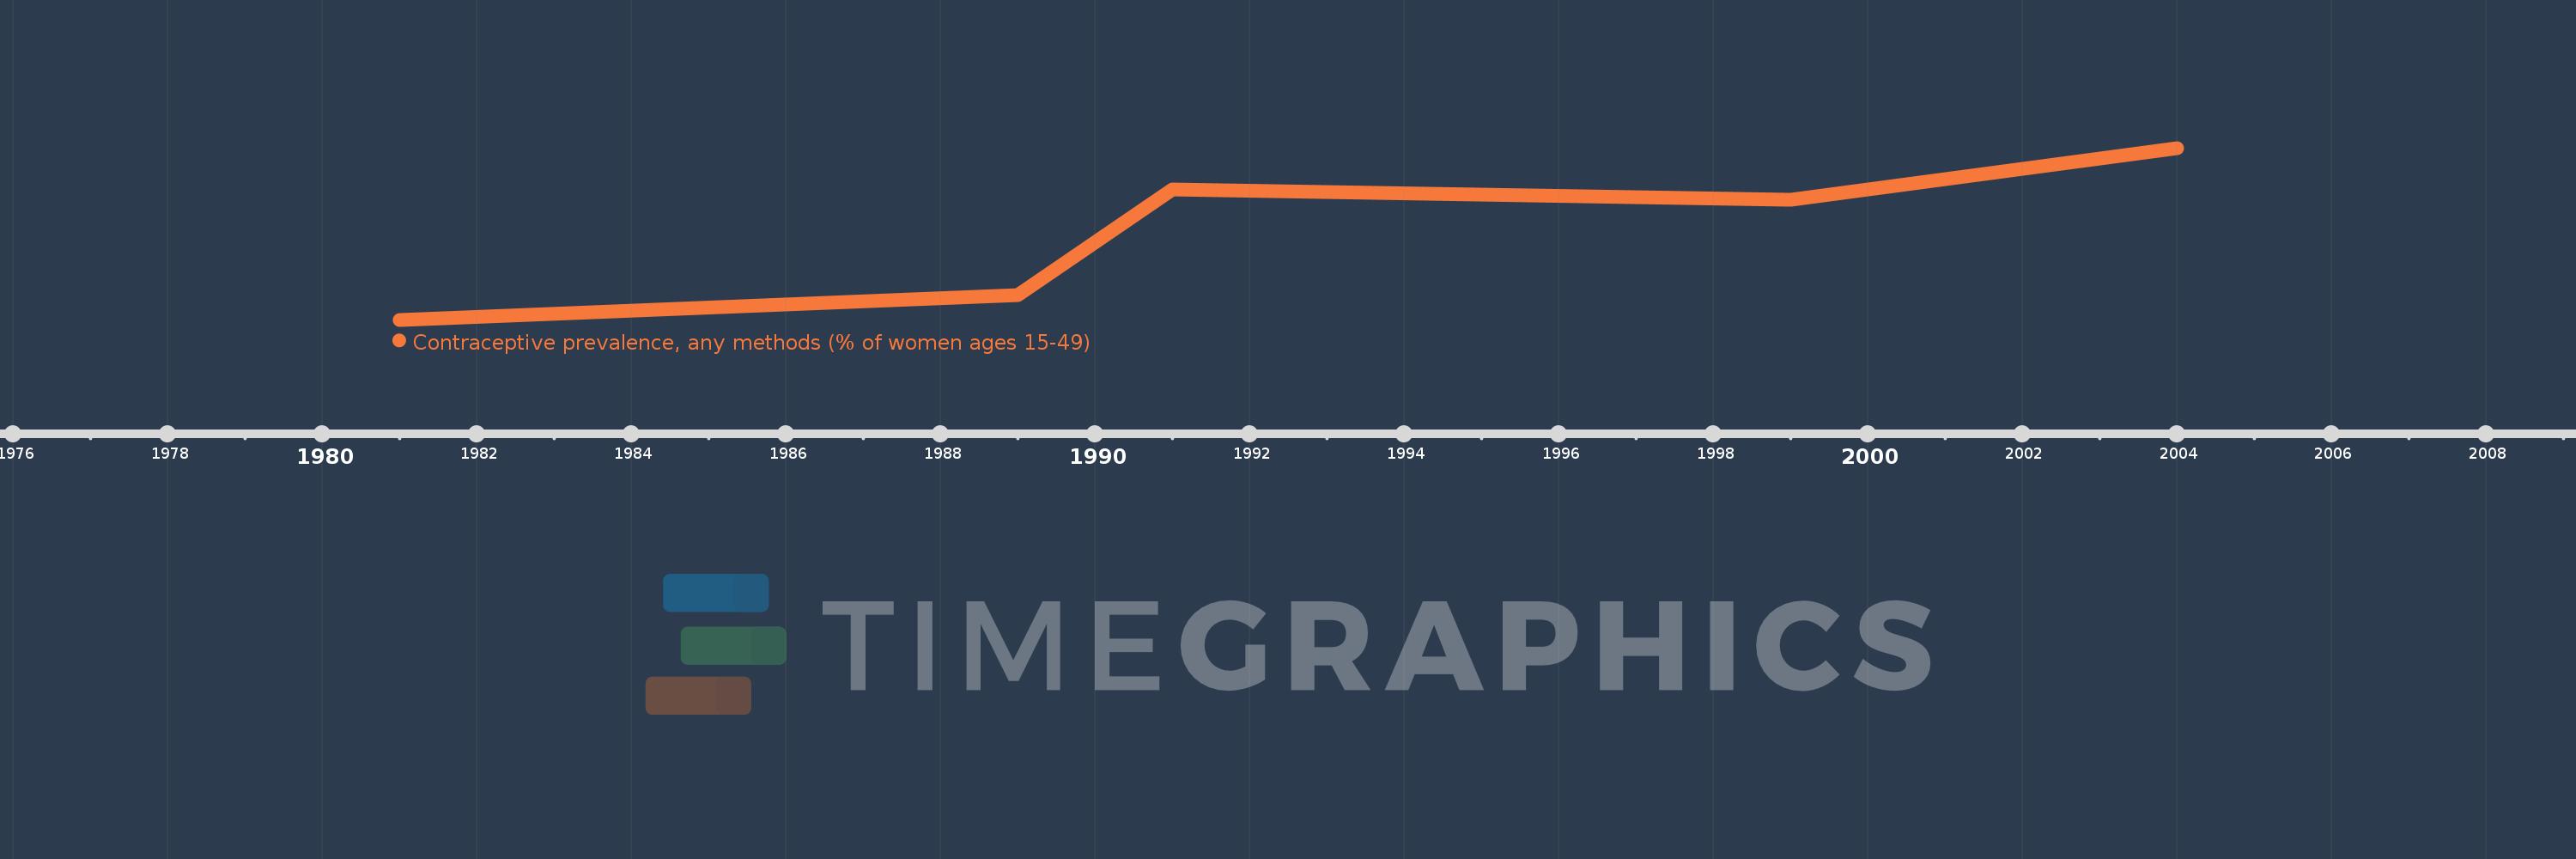
This timeline shows a graph from 1981 to 2004 of South Africa. No data until 1980. Number of actual observations by date: 5.
Source name:
World Development Indicators
Source organization:
UNICEF's State of the World's Children and Childinfo, United Nations Population Division's World Contraceptive Use, household surveys including Demographic and Health Surveys and Multiple Indicator Cluster Surveys.
Categories, topics:
Health, Gender
Last updated:
apr 23, 2017
Indicators value changes by year
Meaning:
54.18
Minimum:
48.0
jan 1, 1981
Maximum:
59.9
jan 1, 2004
At the date of observation
Value
Absolute change
Change from the previous value
jan 1, 1981
48.0
+48.0
0.0%
jan 1, 1989
49.7
+1.7
3.54%
jan 1, 1991
57.0
+7.3
14.69%
jan 1, 1999
56.3
-0.7
-1.23%
jan 1, 2004
59.9
+3.6
6.39%
Ranking of countries by current statistics by years
