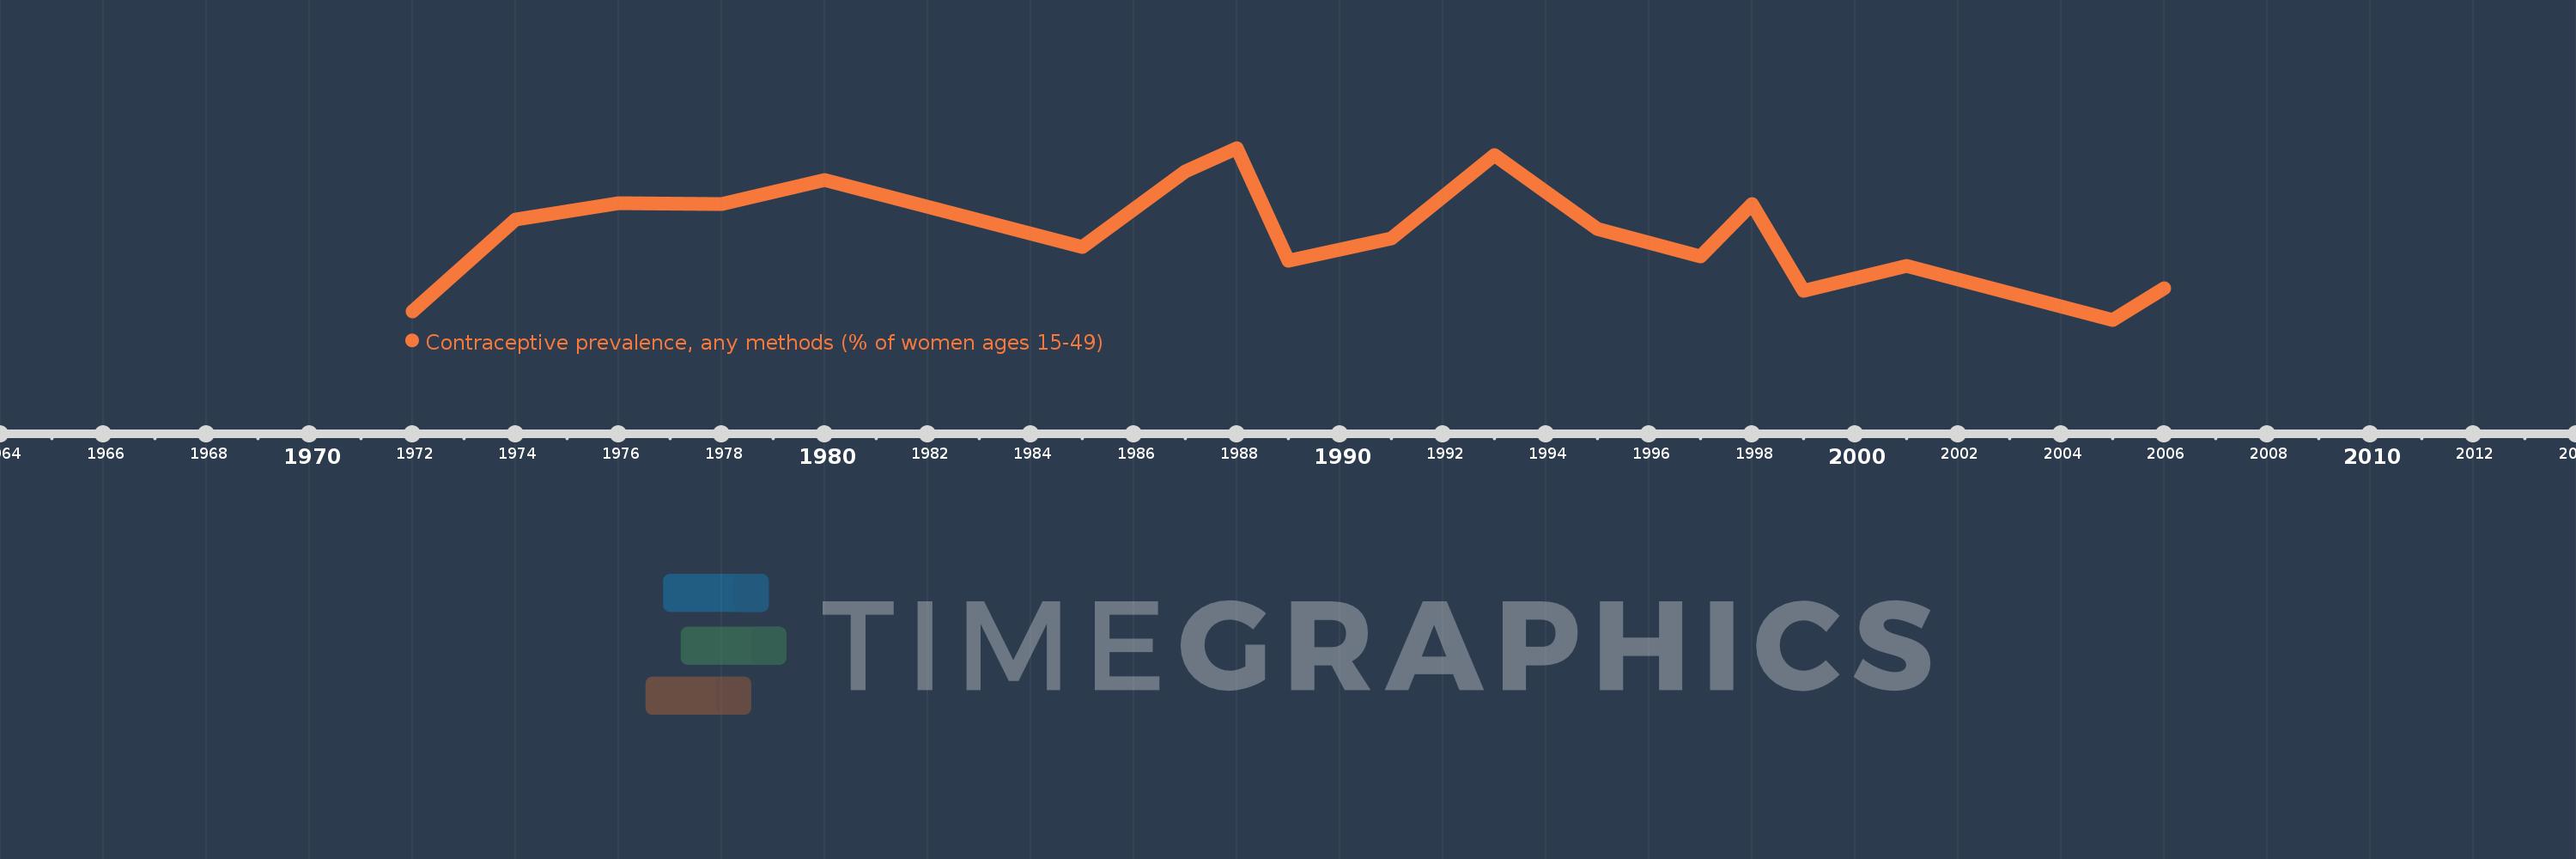
This timeline shows a graph from 1972 to 2006 of Japan. No data until 1971. Number of actual observations by date: 18.
Source name:
World Development Indicators
Source organization:
UNICEF's State of the World's Children and Childinfo, United Nations Population Division's World Contraceptive Use, household surveys including Demographic and Health Surveys and Multiple Indicator Cluster Surveys.
Categories, topics:
Health, Gender
Last updated:
apr 23, 2017
Indicators value changes by year
Meaning:
58.317
Minimum:
52.0
jan 1, 2005
Maximum:
64.5
jan 1, 1988
At the date of observation
Value
Absolute change
Change from the previous value
jan 1, 1972
52.6
+52.6
0.0%
jan 1, 1974
59.3
+6.7
12.74%
jan 1, 1976
60.5
+1.2
2.02%
jan 1, 1978
60.4
-0.1
-0.17%
jan 1, 1980
62.2
+1.8
2.98%
jan 1, 1985
57.3
-4.9
-7.88%
jan 1, 1987
62.8
+5.5
9.6%
jan 1, 1988
64.5
+1.7
2.71%
jan 1, 1989
56.3
-8.2
-12.71%
jan 1, 1991
57.9
+1.6
2.84%
jan 1, 1993
64.0
+6.1
10.54%
jan 1, 1995
58.6
-5.4
-8.44%
jan 1, 1997
56.6
-2.0
-3.41%
jan 1, 1998
60.4
+3.8
6.71%
jan 1, 1999
54.1
-6.3
-10.43%
jan 1, 2001
55.9
+1.8
3.33%
jan 1, 2005
52.0
-3.9
-6.98%
jan 1, 2006
54.3
+2.3
4.42%
Ranking of countries by current statistics by years
