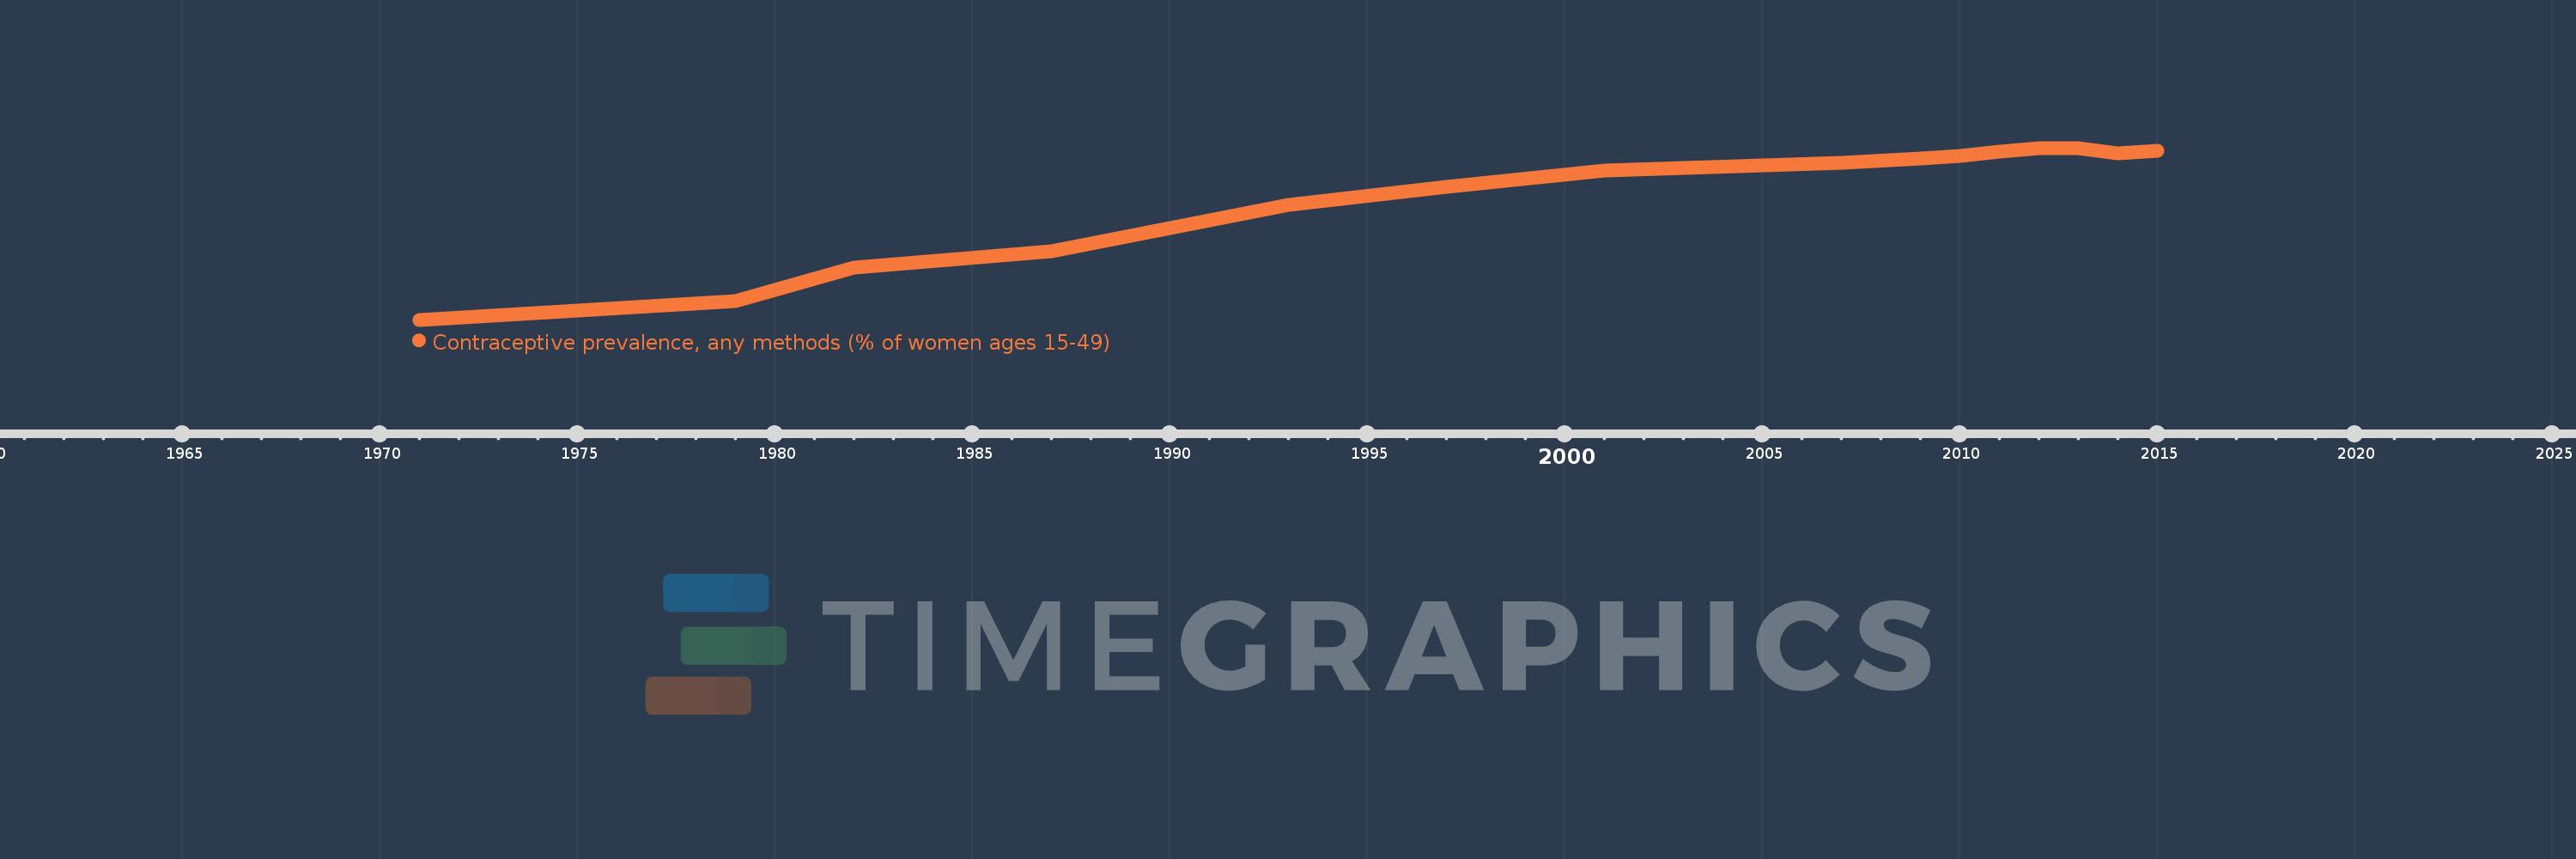
This timeline shows a graph from 1971 to 2015 of Peru. No data until 1970. Number of actual observations by date: 16.
Source name:
World Development Indicators
Source organization:
UNICEF's State of the World's Children and Childinfo, United Nations Population Division's World Contraceptive Use, household surveys including Demographic and Health Surveys and Multiple Indicator Cluster Surveys.
Categories, topics:
Health, Gender
Last updated:
apr 23, 2017
Indicators value changes by year
Meaning:
62.35
Minimum:
26.0
jan 1, 1971
Maximum:
75.5
jan 1, 2013
At the date of observation
Value
Absolute change
Change from the previous value
jan 1, 1971
26.0
+26.0
0.0%
jan 1, 1979
31.4
+5.4
20.77%
jan 1, 1982
41.0
+9.6
30.57%
jan 1, 1987
45.8
+4.8
11.71%
jan 1, 1993
59.0
+13.2
28.82%
jan 1, 1997
64.2
+5.2
8.81%
jan 1, 2001
68.9
+4.7
7.32%
jan 1, 2005
70.5
+1.6
2.32%
jan 1, 2007
71.3
+0.8
1.13%
jan 1, 2009
72.4
+1.1
1.54%
jan 1, 2010
73.2
+0.8
1.1%
jan 1, 2011
74.4
+1.2
1.64%
jan 1, 2012
75.4
+1.0
1.34%
jan 1, 2013
75.5
+0.1
0.13%
jan 1, 2014
74.0
-1.5
-1.99%
jan 1, 2015
74.6
+0.6
0.81%
Ranking of countries by current statistics by years
